IN THIS LIST

Conceptualizing a Paris-Aligned Climate Index for the Eurozone

S&P 500® Low Volatility Index: Five Decades of History

China's New Economy Sectors: How Are They Doing?

Blending Low Volatility with Dividend Yield in the China A-Share Market

Making STRIDEs in Evaluating the Performance of Retirement Solutions

Conceptualizing a Paris-Aligned Climate Index for the Eurozone

Contributor Image
Leonardo M. Cabrer

Director, Global Research & Design

S&P Dow Jones Indices

On the brink of irreversible climate change, a combination of ground-breaking datasets and index innovation is emerging, through which investors will have the choice to align their investments to a future climate scenario compatible with mitigating catastrophic global warming to the planet. This new breed of sustainable climate indices will not only offer solutions that intend to be impactful, but equally aim to provide investors with reduced risks from transitioning to a low-carbon economy and the consequences of physical, environmental events while capturing financial opportunities that arise.

Based on scientific evidence around the need for a 1.5°C1 global warming scenario to be hit (Masson-Delmotte, et al., 2018), the EU Technical Expert Group (TEG) has released its final report (The EU Technical Expert Group on Sustainable Finance, 2019), outlining two new climate benchmarks. This paper describes an S&P Dow Jones Indices (S&P DJI) concept for the eurozone region, which is aligned with the more stringent of these two new climate benchmarks: the Paris-Aligned Benchmark.

The index concept uses pioneering, forward-looking Trucost datasets to meet multiple climate objectives, aligned with a 1.5°C scenario and the Task Force on Climate-related Financial Disclosures (TCFD) recommendations, while incorporating the Science Based Targets Initiatives-endorsed climate transition approaches and state-of-the-art Trucost physical risk data.

Exhibit 1: Data Inputs into the PAC Concept

Conceptualizing a Paris-Aligned Climate Index for the Eurozone: Exhibit 1

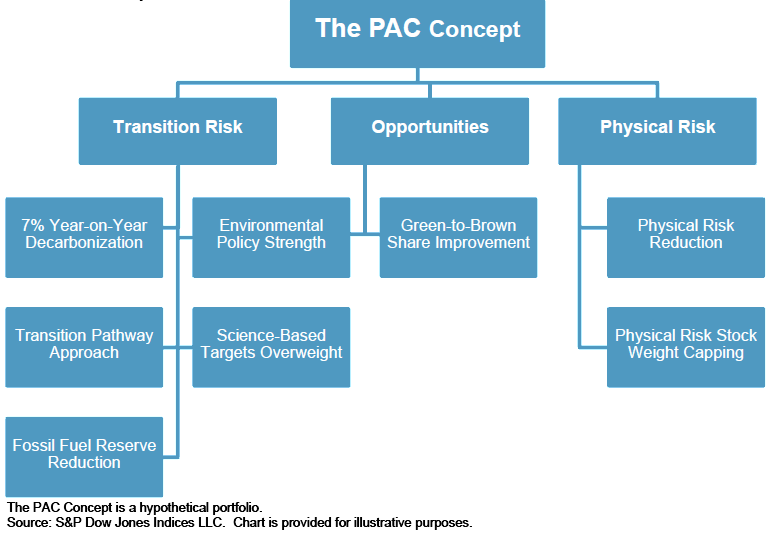
Exhibit 1 outlines the inputs into the S&P Eurozone Paris-Aligned Climate Index Concept (PAC Concept), which enable the climate objectives achievement. This paper outlines how climate-related objectives can be met, due to the use of optimization, while maintaining similar performance to the underlying index, with low tracking error. This results in a broad, diversified index that should perform similarly to the underlying index. Factor analysis shows there to be unexplained alpha that may be driven by the climate strategy of the PAC Concept.

pdf-icon PD F Download Full Article

1 Global warming should not exceed 1.5°C above pre-industrial levels. 2 A part of S&P Global.


S&P 500® Low Volatility Index: Five Decades of History

Contributor Image
Phillip Brzenk

Managing Director, Global Head of Multi-Asset Indices

S&P Dow Jones Indices

Contributor Image
Hamish Preston

Head of U.S. Equities

S&P Dow Jones Indices

Contributor Image
Izzy Wang

Senior Analyst, Factors and Dividends

S&P Dow Jones Indices

S&P Dow Jones Indices (S&P DJI) publishes a series of low volatility indices, offering market participants a perspective on the returns of lower volatility equities and forming the basis for index-linked products globally.1 Low volatility indices have typically outperformed their underlying broad market benchmarks on both an absolute and a risk-adjusted basis.2 S&P DJI recently extended the returns history for one of the widely followed low volatility benchmarks—the S&P 500 Low Volatility Index—back to February 1972.3 Using the additional two decades of return information, this paper:

• Offers a longer-term perspective on the ability of low volatility indices to combine downside protection and upside participation;

• Assesses the relative importance of equity market movements and interest rates in explaining the low volatility index’s performance; and

• Demonstrates the potential applications of low volatility indices.

Exhibit 1 shows the risk-adjusted returns for the S&P 500 Low Volatility Index and the S&P 500 in each decade since 1972.

S&P 500 Low Volatility Index: Five Decades of History: Exhibit 1

Source: S&P Dow Jones Indices LLC. Chart based on daily data between Feb. 18, 1972, and Dec. 31, 2019. Risk-adjusted returns based on the ratio of annualized returns to annualized volatility. Past performance is no guarantee of future results. Chart is provided for illustrative purposes and reflects hypothetical historical performance. Please see the Performance Disclosure at the end of this document for more information regarding the inherent limitations associated with back-tested performance.

pdf-icon PD F Download Full Article

1 Please see Appendix A for an overview of the low volatility indices offered by S&P Dow Jones Indices. 2 Chan, Fei Mei and Craig J. Lazzara, “Is the Low Volatility Anomaly Universal?,” S&P Dow Jones Indices, April 2019. 3 Previously, the returns data began in November 1990.


China's New Economy Sectors: How Are They Doing?

Contributor Image
Priscilla Luk

Managing Director, Global Research & Design, APAC

S&P Dow Jones Indices

Contributor Image
Liyu Zeng

Director, Global Research & Design

S&P Dow Jones Indices

China’s economy is shifting from being primarily focused on investment and manufacturing to a consumption- and services-driven market.  In this paper, we use the S&P New China Sectors Index to analyze China’s growing economic sectors and examine their equity, fundamental, and price performance characteristics.

EXECUTIVE SUMMARY
  • The main sectors and industries benefiting from China’s economic Global Research & Design transformation are Consumer Discretionary, Consumer Staples,Communication Services, Health Care, Insurance, and Independent Power and Renewable Electricity Producers.
     
  • As China’s structural economic reforms deepen, the demand for benchmarks tracking sector drivers is increasing.The S&P New China Sectors Index is designed to provide equity insight into China’s new economy sectors.
  • The S&P New China Sectors Index has its largest overweights in Consumer Discretionary, Communication Services, and Consumer Staples, and its largest underweights are in Industrials, Materials, and Financials, compared with the broad Chinese equities market.
  • The S&P New China Sectors Index recorded an annualized return of 8.5% between Dec. 31, 2010, and Sept. 30, 2019, outperforming the S&P China 500 by 4.3%, indicating that the new economy sectors performed better than the broad equity market.
  • The outperformance of the S&P New China Sectors Index was dominated by sector-allocation effects.
  • New economy companies featured higher revenue growth, higher profitability, and lower leverage than the broader equities market, and they tended to be priced with higher valuation and lower dividend yield.

pdf-icon PD F Download Full Article

Blending Low Volatility with Dividend Yield in the China A-Share Market

Contributor Image
Priscilla Luk

Managing Director, Global Research & Design, APAC

S&P Dow Jones Indices

Contributor Image
Liyu Zeng

Director, Global Research & Design

S&P Dow Jones Indices

EXECUTIVE SUMMARY

This paper examines the potential benefits of blending high dividend and low volatility strategies in the China A-share large-cap equity market.

  • Excluding high volatility stocks from a high-dividend-yield portfolio may reduce portfolio volatility and improve portfolio returns on a risk-adjusted basis.
  • The S&P China A-Share LargeCap Low Volatility High Dividend 50 Index overlays a low volatility screen on high dividend stocks. For the period from Jan. 31, 2009, to June 28, 2019, the index delivered pronounced excess returns on an absolute and risk-adjusted basis.
  • This index delivered a stable source of income from dividends and showed defensive qualities, with reduced drawdown during down markets.
  • The active exposure to dividend yield, low volatility, and value factors contributed most to the active returns, while the sector allocation bias accounted for most of the active risk for the index.

INTRODUCTION

Dividend investment is a popular investment strategy among incomeseeking market participants. Since they were first launched in 2003, dividend ETFs with diverse designs have proliferated across regions of varied characteristics.

In September 2012, S&P Dow Jones Indices launched the S&P 500® Low Volatility High Dividend Index. It uses a unique, rule-based dividend strategy that is designed to combine high dividend yield and low return volatility in a single index. Compared with pure dividend-yield-based strategies, this index has been shown to provide enhanced risk-adjusted performance and incremental defensiveness, which can be particularly attractive to conservative investors.

In the following sections, we examine the effectiveness of a low volatility high dividend yield strategy in the China A-share large-cap equity market, based on companies in the S&P China A Domestic LargeCap Index. We also demonstrate indexing implementation of this strategy using the S&P China A-Share LargeCap Low Volatility High Dividend 50 Index.

pdf-icon PD F Download Full Article

Making STRIDEs in Evaluating the Performance of Retirement Solutions

EXECUTIVE SUMMARY

The S&P Shift to Retirement Income and Decumulation (STRIDE) Index Series incorporates an innovative risk management framework focused on providing increasing levels of clarity and stability around sustainable annual consumption in retirement. This paper tests S&P STRIDE’s approach to consumption risk management and asset allocation over the period from 2003 to 2018 for a hypothetical cohort of 2010 retirees by comparing the S&P STRIDE Glide Path 2010 Index Total Return to the average 2010 target date fund (TDF). Our main findings are as follows.

  • The risk management approach employed by S&P STRIDE would have helped reduce uncertainty about retirement income through a period of variable interest rates, inflation, and market returns. In particular, we show how the risk management component of the S&P STRIDE Index can provide clarity and stability around affordable future consumption prior to and into retirement. The approach aims to help retirement plan participants seamlessly transition from accumulation to retirement.
  • The risk management strategy can be used to reduce the impact of market, inflation, interest rate, and sequencing risks on retirement consumption.
  • In contrast, we find that an industry average of traditional 2010 TDFs exhibited high variability in terms of retirement consumption over the period. Estimates of affordable consumption from such a strategy were highly sensitive to market risk, interest rates, and inflation. As a result, these strategies demonstrated large fluctuations in the level of expected retirement consumption over the period.
  • INTRODUCTION

    Retirement can mean different things to different people. For some, retirement means a complete stop from working. For others, it means ending a professional career in pursuit of something new. Regardless of the definition, retirement normally marks the point when the primary source of income ends and savers begin to rely on their accumulated balances to maintain their standard of living. Therefore, in the context of retirement, a primary goal is often to be able to sustain an inflation-adjusted stream of income, or a level of consumption associated with a standard of living, throughout retirement and to have relevant and meaningful information about what that level of sustainable consumption stream is before and throughout retirement.

    pdf-icon PD F Download Full Article

Processing ...