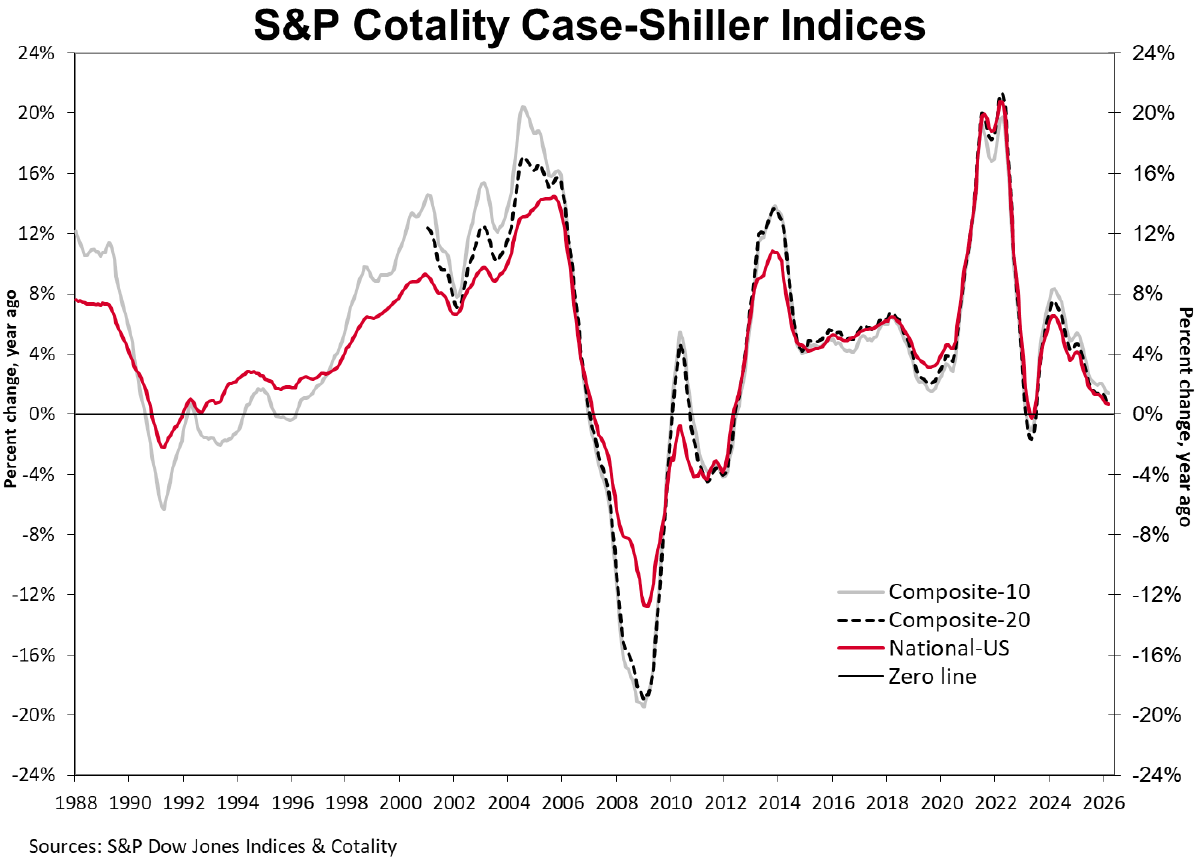
- The S&P Cotality Case-Shiller U.S. National Home Price NSA Index posted a 0.7% annual gain for March 2026, down from a 0.8% rise in the previous month.
- More than half of major U.S. metropolitan markets posted year-over-year price declines in March, with Seattle (-2.5%) displacing Denver as the weakest market and Chicago (6.1%) remaining the strongest.
- For the 10th consecutive month, inflation outpaced national home price appreciation, with March CPI running 2.6 percentage points above the 0.7% annual gain, extending the streak of negative real home price returns.
NEW YORK, MAY 26, 2026:S&P Dow Jones Indices (S&P DJI) today released the March 2026 results for the S&P Cotality Case-Shiller Indices.
More than 27 years of history are available for the data series and can be accessed in full by going to www.spglobal.com/spdji/en/index-family/indicators/sp-Cotality-case-shiller.
Cotality continues to have transaction delays from the recording office in Wayne County, the most populous county in the Detroit metro area. These delays impacted the March transaction data and, therefore, no valid March 2026 update of the Detroit S&P Cotality Case-Shiller Index will be provided for the May 26, 2026, release date. There was, however, enough data to calculate a valid February 2026 update, which is provided in Tables 2 and 3.
S&P DJI will continue to provide updates to the Detroit index values for the month(s) with missing sale transactions data.
ANALYSIS
"More than half of the 20 major U.S. housing markets recorded year-over-year price declines in March, reflecting a broadening and deepening housing slowdown," said Nicholas Godec, CFA, CAIA, CIPM, Head of Fixed Income Tradables & Commodities at S&P Dow Jones Indices. "The S&P Cotality Case-Shiller National Home Price Index edged up just 0.7% in March from a year earlier, decelerating from February’s 0.8% rate. With consumer inflation accelerating to roughly 3.3% in March, U.S. home values have now fallen in real terms for the 10th consecutive month, underscoring an ongoing erosion of inflation-adjusted housing wealth.
"The geographic divergence remains stark," Godec continued. "Midwest and Northeast markets are sustaining modest growth, while much of the Sun Belt and Western regions are still seeing declines. Chicago led all cities with a 6.1% annual gain, followed by New York (4.0%) and Cleveland (3.0%). In contrast, Seattle’s 2.5% year-over-year decline was the steepest in March, with Denver (-2.0%), Tampa (-1.9%), Dallas (-1.7%), and Phoenix (-1.6%) joining Seattle among the weakest performers. Even Los Angeles (-1.6%) and Washington (-0.1%) turned negative. The spread between the strongest and weakest markets – 8.6 percentage points, from Chicago’s +6.1% to Seattle’s -2.5% – highlights how localized this housing cycle has become. (Detroit’s March reading remains unavailable due to local transaction data delays.)
"Monthly price movements offered a seasonal spring lift but little underlying momentum. Before seasonal adjustment, the National Index climbed 0.7% from February, and even double-digit composite markets like the 10-City and 20-City posted strong March gains (1.2% and 1.0% NSA, respectively). Yet after seasonal adjustment, the National and 20-City indices both slipped 0.2%, and the 10-City ticked down 0.03%, confirming that demand remains soft as we head into spring. The latest six months saw only a negligible 0.3% rise in national home prices, barely keeping pace with the 0.3% in the prior half-year – a sign of a housing market nearly at a standstill.
"Mortgage rates, meanwhile, have resumed climbing. The 30-year fixed rate dipped below 6% in late February but rebounded to roughly 6.4% by the end of March, re-intensifying the affordability squeeze on buyers and potentially further damping home sales and price growth," Godec concluded.
YEAR-OVER-YEAR
The S&P Cotality Case-Shiller U.S. National Home Price NSA Index, covering all nine U.S. census divisions, reported a 0.7% annual gain for March. The 10-City Composite saw an annual increase of 1.4%, down from a 1.5% increase in the previous month. The 20-City Composite posted a year-over-year increase of 0.8%, down from a 0.9% rise in the previous month.
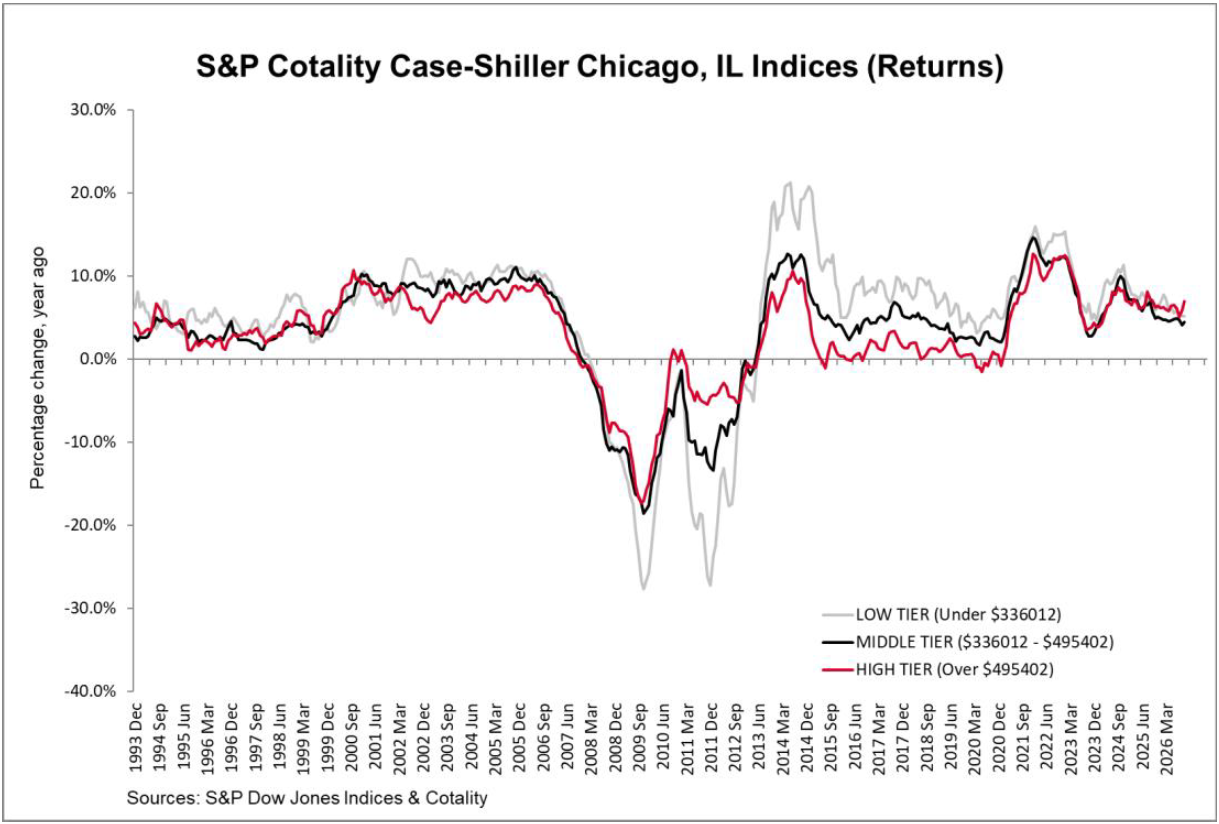
Chicago reported the highest annual gain among the 20 cities with a 6.1% increase in March, followed by New York and Cleveland with annual increases of 4.0% and 3.0%, respectively. Seattle posted the lowest return in March, falling 2.5%. The chart below compares year-over-year returns for different housing price ranges (tiers) in Chicago.
MONTH-OVER-MONTH
The pre-seasonally adjusted U.S. National, 10-City Composite, and 20-City Composite Indices recorded annual gains of 0.7%, 1.2%, and 1.0%, respectively.
After seasonal adjustment, the U.S. National and 20-City Composite Indices reported a monthly decrease of 0.2% and the 10-City Composite Index posted a 0.03% drop.
SUPPORTING DATA
The S&P Cotality Case-Shiller U.S. National Home Price NSA Index, which covers all nine U.S. census divisions, recorded a 0.7% annual increase in March 2026. The 10-City and 20-City Composites reported year-over-year increases of 1.4% and 0.8%, respectively. The chart below depicts the annual returns of the U.S. National, 10-City Composite, and 20-City Composite Home Price Indices.