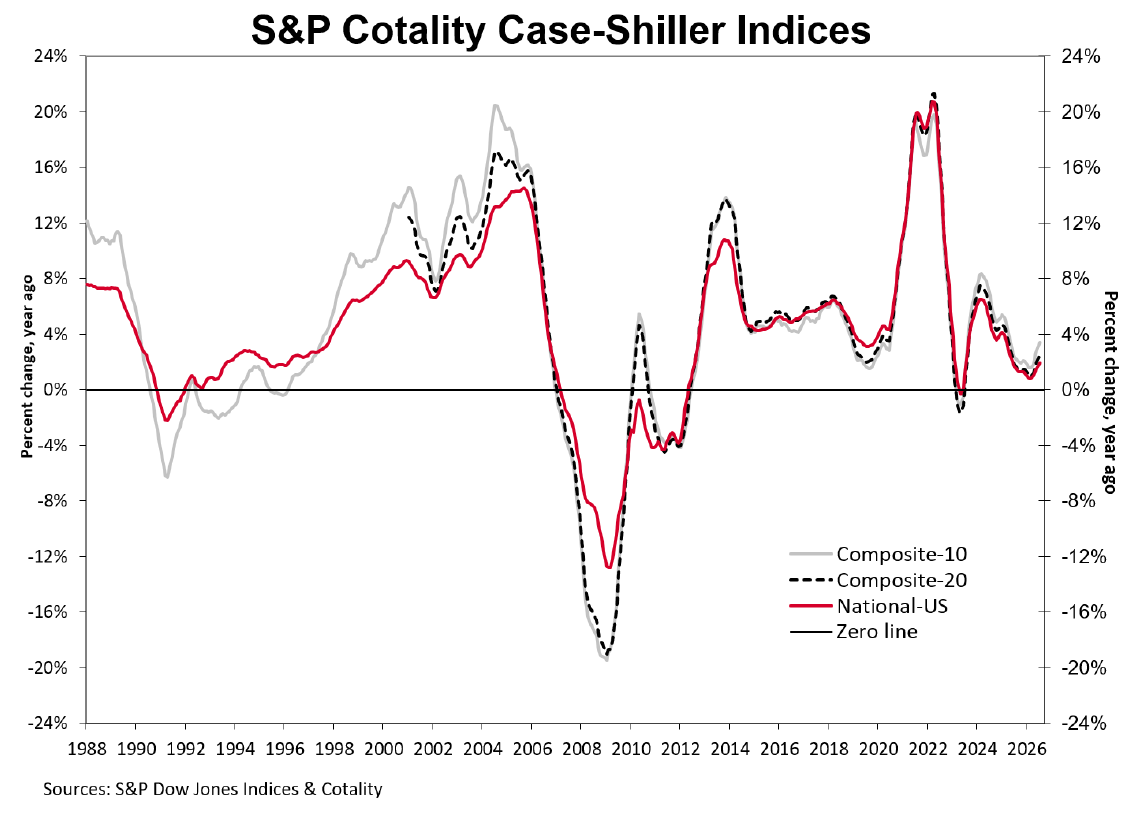
- The S&P Cotality Case-Shiller U.S. National Home Price NSA Index posted a 1.9% annual gain for July 2026, up from a 1.6% rise in the previous month.
- S. home values fell in real terms for the 14th consecutive month, as July’s 3.4% inflation ran roughly 1.5 percentage points above the 1.9% home price gain.
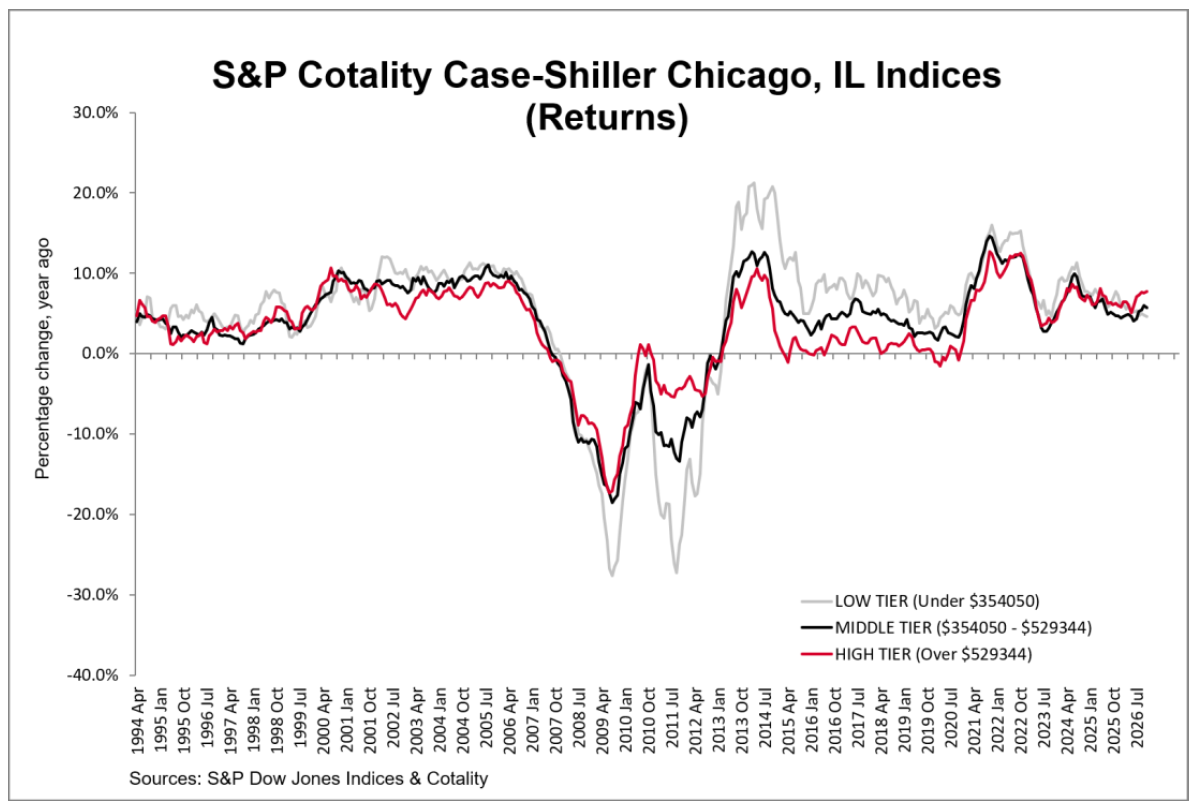
- A nearly 9 percentage point gap separated July’s strongest market (Chicago +6.9% YoY) and its weakest (Seattle -1.6% YoY), underscoring a stark regional divergence in home price trends.
NEW YORK, SEPTEMBER 29, 2026:S&P Dow Jones Indices (S&P DJI) today released the July 2026 results for the S&P Cotality Case-Shiller Indices.
More than 27 years of history are available for the data series and can be accessed in full by going to www.spglobal.com/spdji/en/index-family/indicators/sp-Cotality-case-shiller.
Cotality continues to have transaction delays from the recording office in Wayne County, the most populous county in the Detroit metro area. These delays impacted the July transaction data and, therefore, no valid July 2026 update of the Detroit S&P Cotality Case-Shiller Index will be provided for the September 29, 2026, release date. There was, however, enough data to calculate a valid June 2026 update, which is provided in Tables 2 and 3.
S&P DJI will continue to provide updates to the Detroit index values for the month(s) with missing sale transactions data.
ANALYSIS
“While home prices continued to decline in real terms in July 2026, marking the 14th consecutive month of real declines, slightly lower inflation and stronger nominal home price appreciation helped narrow the gap,” said Rebecca Kaufman, Associate Director of Commodities at S&P Dow Jones Indices. “In July 2026, the S&P CoreLogic Case-Shiller National Home Price Index posted a 1.9% annual gain, up from 1.6% in June. During the same period, consumer prices posted a 3.4% annual gain, down slightly from 3.5% in June.
“For the fifth consecutive month, Chicago led all metros with a 6.9% annual gain in July, followed by New York (5.8%) and Cleveland (4.2%),” Kaufman continued. “Meanwhile, Seattle posted the largest annual decline for the second consecutive month, falling 1.6%, followed by Las Vegas (-1.3%) and Denver (-1.1%).
“The years-long East-West divide persists, with six out of the eight Eastern metropolitan markets recording greater year-over-year changes in July versus June, compared with just two of the eight Western metropolitan markets.
“In a notable departure from typical seasonal patterns, the non-seasonally adjusted National and Composite indices recorded monthly gains smaller than their seasonally adjusted counterparts. On a non-seasonally adjusted basis, the U.S. National and 10-City Composite Indices rose 0.12% and 0.03% month over month, respectively. On a seasonally adjusted basis, they increased 0.3% and 0.4%, respectively. This suggests seasonal factors weighed heavily on home prices in July.
“Although inflation remained elevated at 3.4%, much of the increase was concentrated in energy, with energy and gasoline prices rising 14.7% and 24.6%, respectively,” Kaufman concluded. “By contrast, core inflation, which excludes food and energy, rose only 2.5% year over year. This distinction is important because persistent inflation in shelter and other core categories tends to have a more direct impact on housing affordability than energy-driven price fluctuations.”
YEAR-OVER-YEAR
The S&P Cotality Case-Shiller U.S. National Home Price NSA Index, covering all nine U.S. census divisions, reported a 1.9% annual gain for July. The 10-City Composite saw an annual increase of 3.4%, up from a 3.0% increase in the previous month. The 20-City Composite posted a year-over-year increase of 2.5%, up from a 2.2% rise in the previous month.
Chicago reported the highest annual gain among the 20 cities with a 6.9% increase in July, followed by New York and Cleveland with annual increases of 5.8% and 4.2%, respectively. Seattle posted the lowest return in July, falling 1.6%.
MONTH-OVER-MONTH
The pre-seasonally adjusted U.S. National and 10-City Composite Indices recorded monthly gains of 0.12% and 0.03% respectively; while the 20-City Composite Index posted a 0.01% decrease.
After seasonal adjustment, the U.S. National, 10-City, and 20-City Composite Indices posted 0.3%, 0.4%, and 0.3% gains, respectively.
SUPPORTING DATA
The chart below depicts the annual returns of the U.S. National, 10-City Composite, and 20-City Composite Home Price Indices.