- The S&P Cotality Case-Shiller U.S. National Home Price NSA Index posted a 0.9% annual gain for January 2026, down from a 1.1% rise in the previous month.
- For the eighth consecutive month, inflation outpaced national home price appreciation, with CPI running 1.5 percentage points above the 0.9% annual gain — leaving real home values modestly lower year over year.
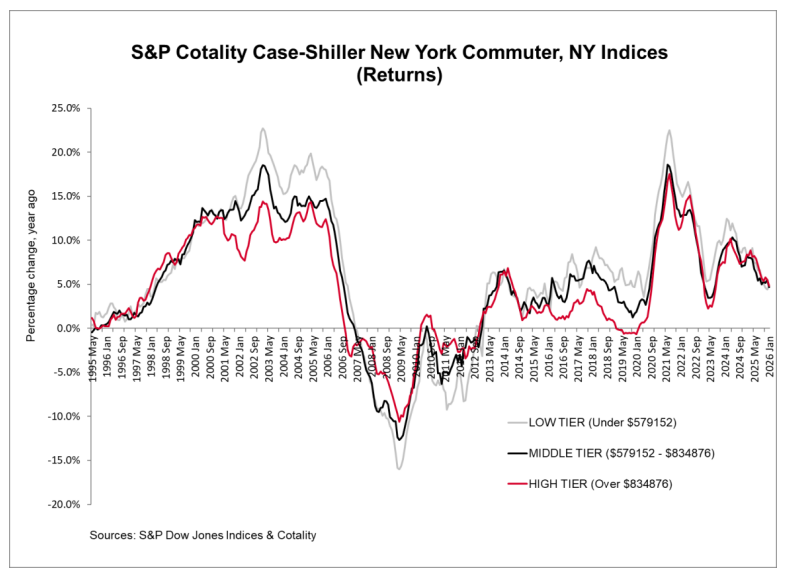
- Geographic divergence persisted, with New York (+4.9%), Chicago (+4.6%), and Cleveland (+3.6%) leading all markets while Tampa extended its decline to -2.5% year over year.
NEW YORK, MARCH 31, 2026: S&P Dow Jones Indices (S&P DJI) today released the January 2026 results for the S&P Cotality Case-Shiller Indices.
More than 27 years of history are available for the data series and can be accessed in full by going to www.spglobal.com/spdji/en/index-family/indicators/sp-Cotality-case-shiller.
Cotality continues to have transaction delays from the recording office in Wayne County, the most populous county in the Detroit metro area. These delays impacted the January transaction data and, therefore, no valid January 2026 update of the Detroit S&P Cotality Case-Shiller Index will be provided for the March 31, 2026, release date. There was, however, enough data to calculate a valid December 2025 update, which is provided in Tables 2 and 3.
S&P DJI will continue to provide updates to the Detroit index values for the month(s) with missing sale transactions data.
ANALYSIS
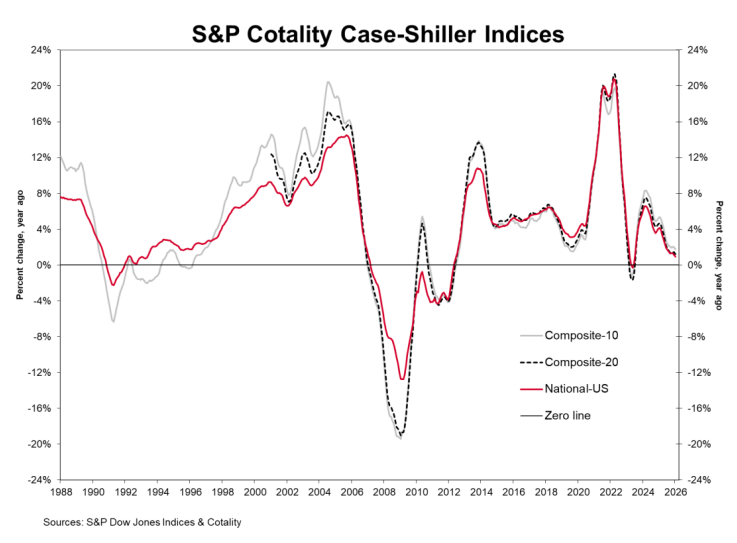
"January's results show home price gains continuing to cool, with the U.S. National Index up 0.9% year over year — down from 1.1% in the prior month," said Nicholas Godec, CFA, CAIA, CIPM, Head of Fixed Income Tradables & Commodities at S&P Dow Jones Indices. "The 10-City and 20-City Composites followed the same path, easing to 1.7% and 1.2%, respectively, from 2.0% and 1.4% the prior month. Price levels remain elevated, but the rate of appreciation has slowed materially.
"Splitting the year into two halves sharpens the picture," Godec continued. "The National Index rose 2.2% over the first six months of the period, then fell 1.3% over the most recent six — a swing that explains why annual gains have compressed to under 1% despite prices remaining historically elevated.
"The inflation comparison reinforces the trend," Godec added. "CPI rose 2.4% over the year ended January 2026, 1.5 percentage points above the National Index's 0.9% gain. In real terms, home values have declined modestly over the past year.
"Geographic leadership remains narrow," Godec concluded. "New York leads with a 4.9% annual gain, followed by Chicago at 4.6% and Cleveland at 3.6%, while Tampa fell 2.5%. Monthly price changes were slightly negative before seasonal adjustment and modestly positive after — consistent with a market that is neither recovering nor correcting sharply. With 30-year mortgage rates still near 6%, affordability constraints show no sign of easing. Nominal prices are barely rising; in real terms, they are edging lower."
YEAR-OVER-YEAR
The S&P Cotality Case-Shiller U.S. National Home Price NSA Index, covering all nine U.S. census divisions, reported a 0.9% annual gain for January. The 10-City Composite saw an annual increase of 1.7%, down from a 2.0% increase in the previous month. The 20-City Composite posted a year-over-year increase of 1.2%, down from a 1.4% rise in the previous month.
New York reported the highest annual gain among the 20 cities with a 4.9% increase in January, followed by Chicago and Cleveland with annual increases of 4.6% and 3.6%, respectively. Tampa posted the lowest return in January, falling 2.5%.
MONTH-OVER-MONTH
The pre-seasonally adjusted U.S. National Index and the 20-City Composite Index saw a drop of 0.1% and the 10-City Composite decreased 0.03%.
After seasonal adjustment, the U.S. National, 10-City Composite, and 20-City Composite Indices each reported a monthly increase of 0.2%.
SUPPORTING DATA
The S&P Cotality Case-Shiller U.S. National Home Price NSA Index, which covers all nine U.S. census divisions, recorded a 0.9% annual increase in January 2026. The 10-City and 20-City Composites reported year-over-year increases of 1.7% and 1.2%, respectively.