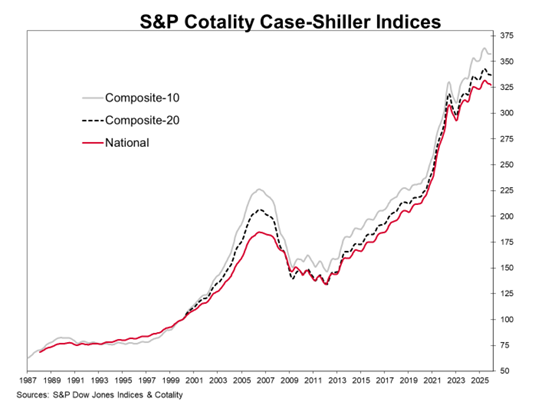
- The S&P Cotality Case-Shiller U.S. National Home Price NSA Index posted a 1.3% annual gain for December 2025, down from a 1.4% rise in the previous month.
- Inflation outpaced home price appreciation from June 2025 onward, eroding real home values through year-end and reversing a decade-long trend of positive real returns.
- Geographic divergence widened sharply: Chicago and New York led all markets with gains above 5%, while Tampa, Phoenix, Dallas, and Miami posted the steepest declines among markets that finished the year in negative territory.
NEW YORK, FEBRUARY 24, 2026: S&P Dow Jones Indices (S&P DJI) today released the December 2025 results for the S&P Cotality Case-Shiller Indices.
More than 27 years of history are available for the data series and can be accessed in full by going to www.spglobal.com/spdji/en/index-family/indicators/sp-Cotality-case-shiller.
Cotality continues to have transaction delays from the recording office in Wayne County, the most populous county in the Detroit metro area. These delays impacted the December transaction data and, therefore, no valid December 2025 update of the Detroit S&P Cotality Case-Shiller Index will be provided for the February 24, 2026, release date. There was, however, enough data to calculate a valid November 2025 update, which is provided in Tables 2 and 3.
S&P DJI will continue to provide updates to the Detroit index values for the month(s) with missing sale transactions data.
ANALYSIS
“With December's results, we can now assess 2025's full-year performance in historical context,” said Nicholas Godec, CFA, CAIA, CIPM, Head of Fixed Income Tradables & Commodities at S&P Dow Jones Indices. "National home prices grew just 1.3% for the year — the weakest full-year gain since 2011, when prices fell 3.9%, and 5.3 percentage points below the 6.6% 10-year annual average. Even excluding 2021's near-20% Covid-era surge, the 10-year average annual gain stands at 5.2%, still 3.9 percentage points ahead of this year's result.
“Two structural forces have reshaped the market over recent years: mortgage rates and inflation,” Godec continued. "The 30-year mortgage rate closed 2025 at 6.2%, well above the 4.8% 10-year average and a sharp contrast to the 3.9% average that prevailed from 2016 through 2020. Meanwhile, annual inflation for 2025 came in at 2.7% — modestly below the 3.1% 10-year average — but still outpaced home price appreciation by 1.4 percentage points, effectively eroding real home values for most owners. This marks a notable reversal: Over the prior decade, national home prices outpaced inflation by 3.7 percentage points annually, a dynamic that has quietly reversed, with real home price returns turning negative in June 2025.
“Decomposing 2025 price returns reveals a year of two halves," Godec concluded. "The first six months saw prices rise 2.6%, while the back half delivered nominal declines of 1.3% — and every one of the 20 tracked metro areas posted negative price returns over that same period. At the city level, Chicago (+5.3%), New York (+5.1%), Cleveland (+4.0%), and Minneapolis (+2.7%) led all markets for the full year, while Tampa (-2.9%), Denver (-2.1%), Phoenix (-1.5%), Dallas (-1.5%), and Miami (-1.5%) posted the steepest declines. This geographic divergence reflects the broader reordering underway: Historically steady Midwest and Northeast markets continued to outperform as Sun Belt markets that surged during the pandemic cycle extended their correction.”
YEAR-OVER-YEAR
The S&P Cotality Case-Shiller U.S. National Home Price NSA Index, covering all nine U.S. census divisions, reported a 1.3% annual gain for December. The 10-City Composite saw an annual increase of 1.9%, down from a 2.0% increase in the previous month. The 20-City Composite posted a year-over-year increase of 1.4%, in line with the previous month.
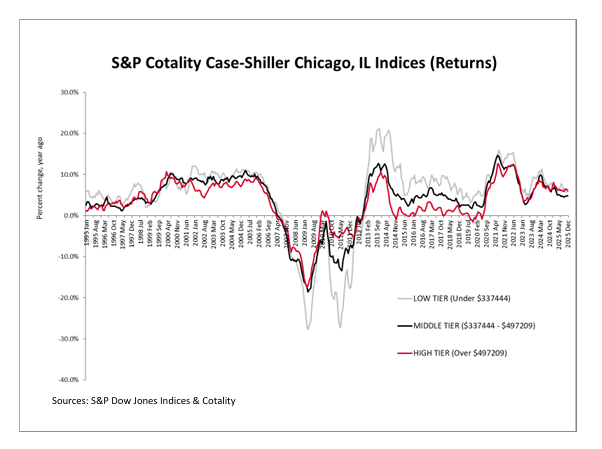
Chicago reported the highest annual gain among the 20 cities with a 5.3% increase in December, followed by New York and Cleveland with annual increases of 5.1% and 4.0%, respectively. Tampa posted the lowest return in December, falling 2.9%. The chart below compares year-over-year returns for different housing price ranges (tiers) in Chicago.
MONTH-OVER-MONTH
The pre-seasonally adjusted U.S. National Index saw a drop of 0.3%, and both the 10-City Composite and the 20-City Composite Indices decreased 0.1%.
After seasonal adjustment, the U.S. National Index reported a monthly increase of 0.4%, and both the 10-City Composite and 20-City Composite Indices posted month-over-month gains of 0.5%.
SUPPORTING DATA
The S&P Cotality Case-Shiller U.S. National Home Price NSA Index, which covers all nine U.S. census divisions, recorded a 1.3% annual increase in December 2025. The 10-City and 20-City Composites reported year-over-year increases of 1.9% and 1.4%, respectively.The chart below depicts the annual returns of the U.S. National, 10-City Composite, and 20-City Composite Home Price Indices.