- The S&P Cotality Case-Shiller U.S. National Home Price NSA Index posted a 1.5% annual gain for August, down from a 1.6% rise in the previous month.
- Housing wealth eroded in real terms for the fourth consecutive month, with the 1.5% national gain falling well short of 3% inflation.
- Nineteen of 20 metros declined month-to-month in August, with only Chicago posting a gain, signaling broad weakness beyond typical seasonal patterns.
NEW YORK, OCTOBER 28, 2025: S&P Dow Jones Indices (S&P DJI) today released the August 2025 results for the S&P Cotality Case-Shiller Indices.
More than 27 years of history are available for the data series and can be accessed in full by going to www.spglobal.com/spdji/en/index-family/indicators/sp-Cotality-case-shiller/.
ANALYSIS
"August's data shows U.S. home prices continuing to slow, with the National Index up just 1.5% year-over-year," said Nicholas Godec, CFA, CAIA, CIPM, Head of Fixed Income Tradables & Commodities at S&P Dow Jones Indices. "This marks the weakest annual gain in over two years and falls well below the 3% inflation rate. For the fourth straight month, home values have lost ground to inflation, meaning homeowners are seeing their real wealth decline even as nominal prices inch higher.
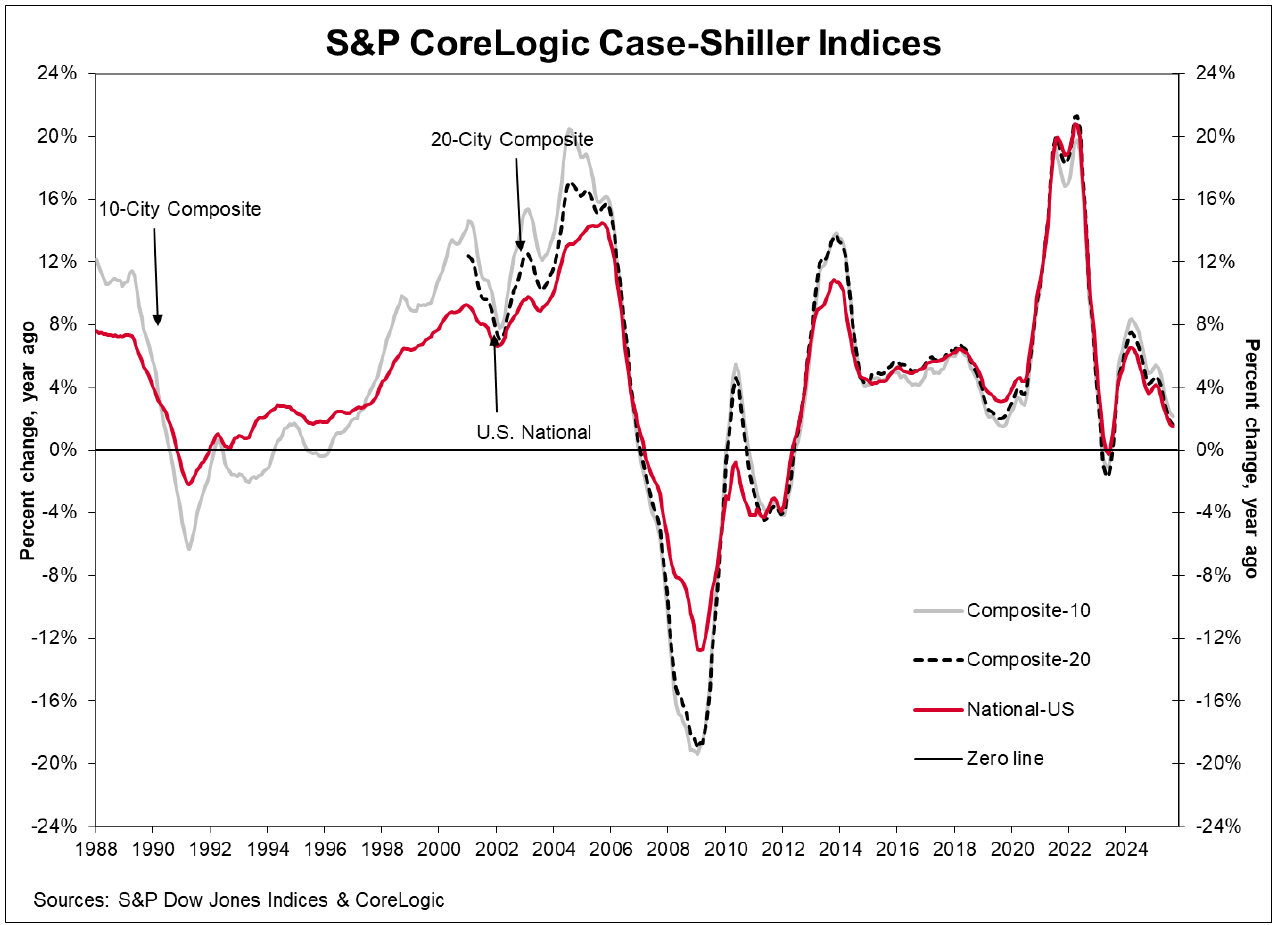
"The National Index rose 1.5% over the past year, with most of that gain coming in the recent six months (up 1.5%) while the prior six months were essentially flat. The 20-City Composite gained 1.6% annually and the 10-City rose 2.1%, both continuing their deceleration from earlier in the year..
"New York again led all metros with a 6.1% annual gain, followed by Chicago at 5.9% and Cleveland at 4.7%. These Midwest and Northeast markets, which saw modest gains during the pandemic, continue to outperform. At the other end, Tampa fell 3.3% year over year, Phoenix dropped 1.7%, and Miami declined 1.7%. Several Western markets also posted losses: San Francisco fell 1.5%, Denver dropped 0.7%, and San Diego declined 0.7%. Seattle turned slightly negative at -0.1%.3"Monthly data for August was weak across the board. Nineteen of 20 cities saw price declines before seasonal adjustment, with only Chicago posting a gain. The National Index fell 0.3% for the month, while both the 10-City and 20-City Composites dropped 0.6%. After seasonal adjustment, all three indices remained negative, suggesting weakness beyond normal seasonal patterns. Phoenix fell 0.9% in August alone, while Los Angeles, Portland, and Denver each dropped between 0.7% and 1.0%.
"Mortgage rates remaining above 6.5% continue to weigh on buyer demand, even during what should be the busy summer season. The combination of high financing costs and prices that remain near record highs has limited transaction activity. Markets that experienced the sharpest pandemic-era gains are now seeing the largest corrections, while more affordable metros with stable local economies are holding up better. Looking ahead, the housing market appears to be finding a new equilibrium after the pandemic boom," Godec concluded. "With price growth running at half the rate of inflation and several major markets in decline, the rapid appreciation of recent years has clearly ended. This adjustment may ultimately lead to a more sustainable market, but for now, homeowners are watching their real equity erode while buyers face the dual challenge of elevated prices and high borrowing costs."
YEAR-OVER-YEAR
The S&P Cotality Case-Shiller U.S. National Home Price NSA Index, covering all nine U.S. census divisions, reported a 1.5% annual gain for August, down from a 1.6% rise in the previous month. The 10-City Composite showed an annual increase of 2.1%, down from a 2.3% increase in the previous month. The 20-City Composite posted a year-over-year increase of 1.6%, down from a 1.8% increase in the previous month.
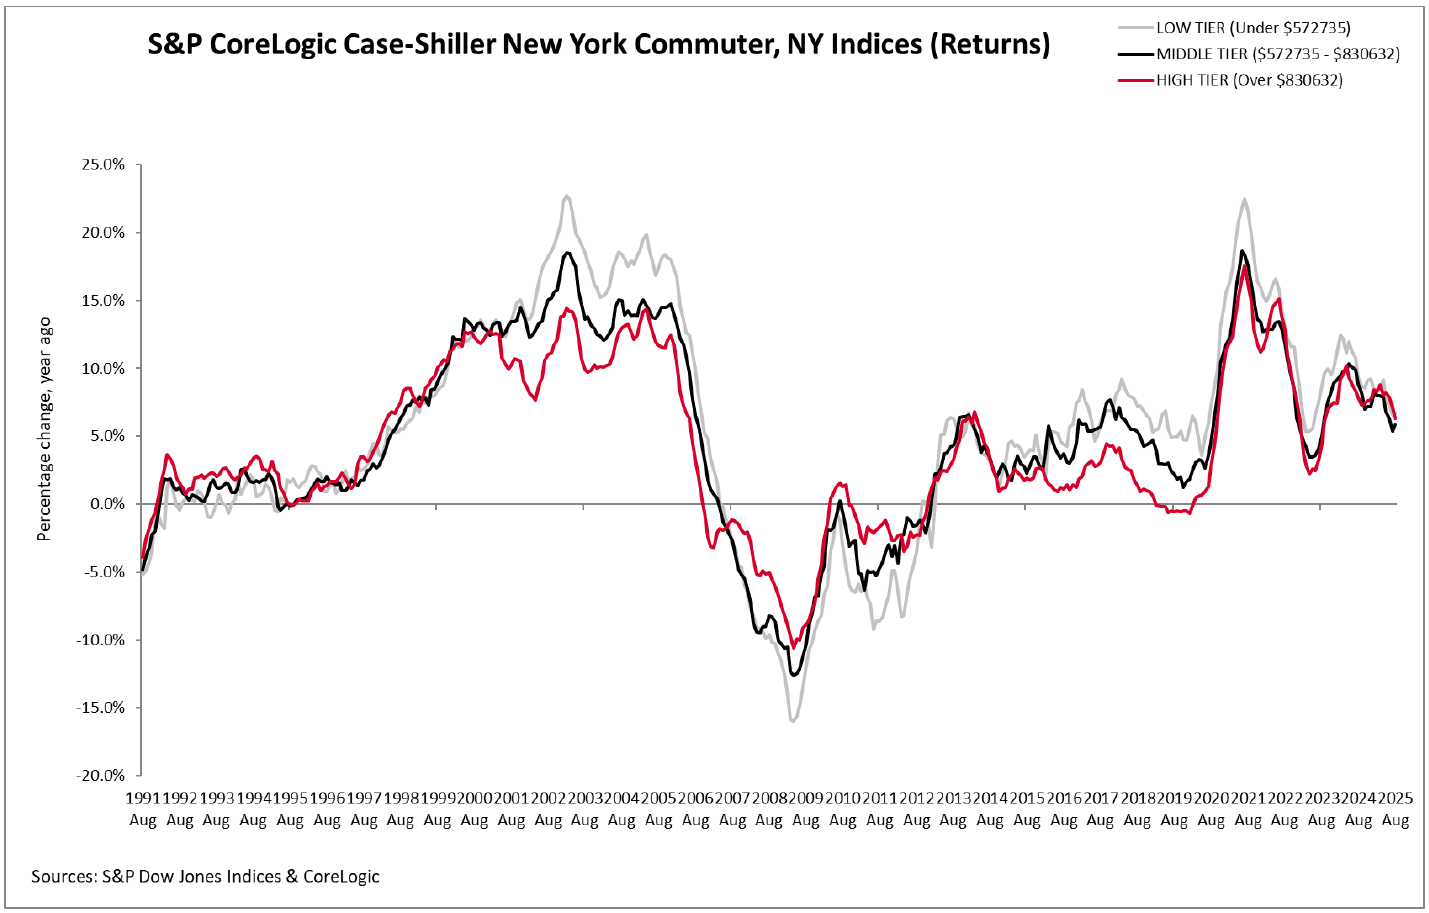
New York again reported the highest annual gain among the 20 cities with a 6.1% increase in August, followed by Chicago and Cleveland with annual increases of 5.9% and 4.7%, respectively. Tampa posted the lowest return, falling 3.3%. The chart below compares year-over-year returns for different housing price ranges (tiers) in New York.
MONTH-OVER-MONTH
The pre-seasonally adjusted U.S. National, 10-City Composite, and 20-City Composite Indices continued to report negative month-over-month change in August, posting -0.3% for U.S. national index and -0.6% for both 10-City and 20-City Composite indices.
After seasonal adjustment, all three indices posted a month-over-month increase of 0.2%.
SUPPORTING DATA
The S&P Cotality Case-Shiller U.S. National Home Price NSA Index, which covers all nine U.S. census divisions, recorded a 1.5% annual increase in August 2025. The 10-City and 20-City Composites reported year-over-year increases of 2.1% and 1.6%, respectively. The chart below depicts the annual returns of the U.S. National, 10-City Composite, and 20-City Composite Home Price Indices.