

What Is Momentum?
As an investment concept, momentum is straightforward—purchase (or avoid) stocks that have performed relatively well (or poorly) recently. The period over which performance is evaluated is important for momentum; for example, there is evidence of a one-month reversal effect in stock prices.
One of the most influential papers on momentum is arguably Mark Carhart’s 1997 study, which showed that adding momentum to the Fama-French three-factor model increased the model’s explanatory power and demonstrated that momentum was a key factor in explaining cross-sectional performance. His study also contributed to momentum being incorporated into risk management and active management processes.
The S&P Momentum Indices are rebalanced semiannually after the close of the third Friday of March and September; the reference dates are the last business day of February and August, respectively. As of each rebalance reference date, momentum is calculated using 12 months of data beginning 13 months prior, ensuring the one-month reversal effect is avoided. The momentum scores for each security are adjusted for risk. Employing risk-adjusted momentum instead of raw price momentum may help mitigate the effects of idiosyncratic risk associated with raw momentum and may also reduce downside risk. For more information regarding the calculation of the S&P Momentum Indices, please see the S&P Momentum Indices Methodology.
How Has Momentum Performed?
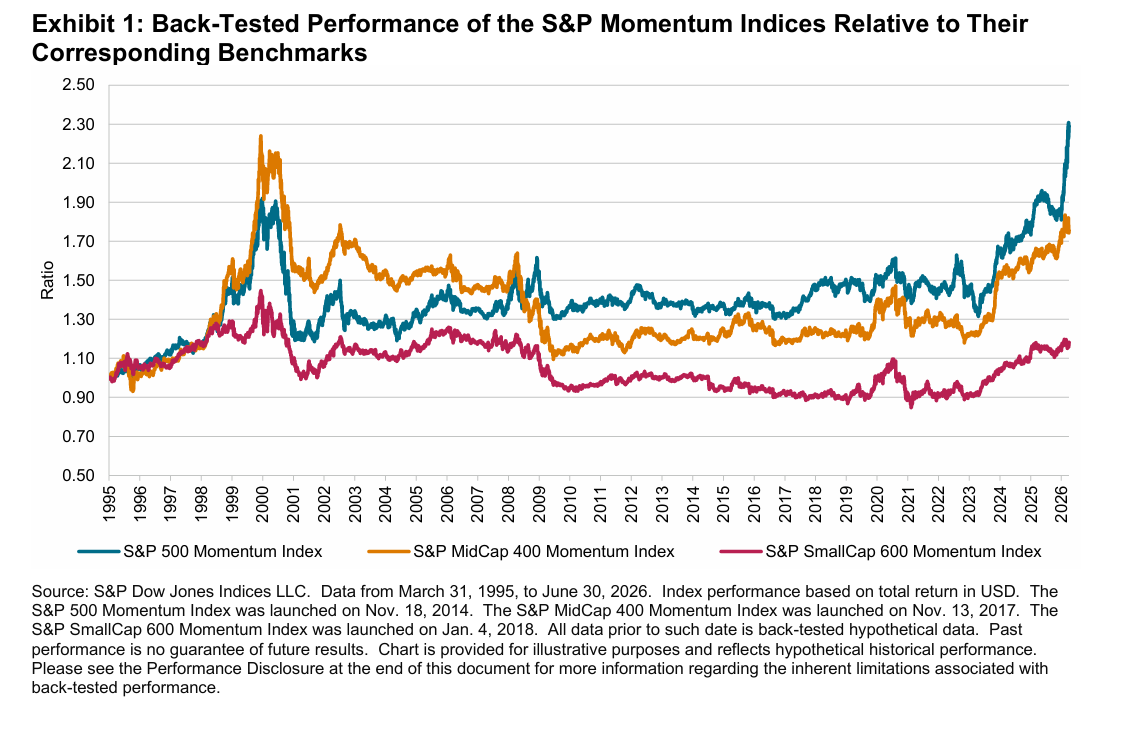
One of the first questions to ask about momentum is: how has it performed? To analyze this, we turn to the S&P 500® Momentum Index, S&P MidCap 400® Momentum Index and S&P SmallCap 600® Momentum Index. Exhibit 1 shows the total return performance of these three momentum indices compared to their underlying benchmarks. As the ratios were typically above one, we can see that the momentum indices generally performed better than their corresponding benchmarks over the period studied. Notably, there were two significant periods of outperformance—1995 to 2000 and 2023 to the end of H1 2026—both of which coincide with strong, sustained market trends, conditions under which momentum strategies tend to perform well. However, if such a trend becomes a bubble that subsequently bursts—as was the case during the technology bubble—momentum may be relatively more affected than the broader market, which is influenced by other factors in addition to momentum.