IN THIS LIST

Indexing Listed Property Stocks in New Zealand

Sector Primer Series: Energy

Sector Primer Series: Consumer Staples

TalkingPoints: Expanding the Equity Opportunity Set in New Zealand

Why Taking a Local Approach to Index Construction Matters in Canada

Indexing Listed Property Stocks in New Zealand

Contributor Image
Michael Orzano

Senior Director, Global Equity Indices

S&P Dow Jones Indices

Publicly traded property stocks allow investors to gain exposure to real estate, an illiquid asset class, without sacrificing the liquidity benefits of listed equities.  Property stocks also typically offer higher yields than the broad equity market, may serve as an effective inflation hedge and may help diversify a portfolio due to their generally low correlations to stocks and bonds.

S&P Dow Jones Indices and NZX Limited jointly launched the S&P/NZX Real Estate Select in November 2015 to serve as an investable benchmark for real estate companies listed on the NZX.  The index includes the largest, most liquid property companies included in the S&P/NZX All Index.  To reduce single stock concentration, the index employs a stock cap of 17.5%, applied semiannually.

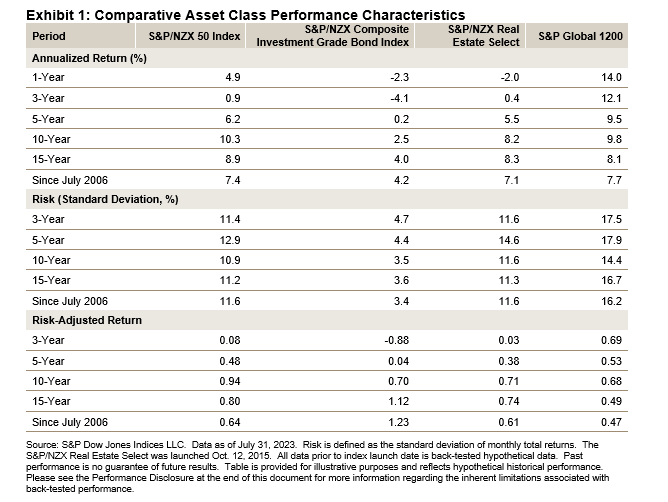
Total returns and volatility of New Zealand equities, as measured by the S&P/NZX 50 Index, and property stocks, as measured by the S&P/NZX Real Estate Select, were relatively similar over the longer term (see Exhibit 1).  This is somewhat surprising, given that global property stocks have historically had higher volatility than the broader global equity market.  As expected, investment grade bond returns were more modest, but much less volatile than equities and property stocks.

Indexing Listed Property Stocks in New Zealand: Exhibit 1

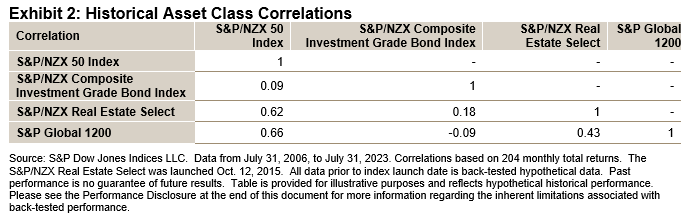
As shown in Exhibit 2, the S&P/NZX Real Estate Select historically had relatively low correlations to both the S&P/NZX 50 Index and the S&P/NZX Composite Investment Grade Bond Index.

Indexing Listed Property Stocks in New Zealand: Exhibit 2

Exhibits 3 and 4 illustrate the potential diversification benefits of adding a listed property allocation to a stylized equity or equity/bond portfolio.  For example, a hypothetical 80%/20% combination of the S&P/NZX 50 Index and S&P/NZX Real Estate Select resulted in a reduction in volatility of over 70 bps compared with a 100% position in the S&P/NZX 50 Index.  This reduction was driven by the relatively low correlation between the indices.

pdf-icon PD F Download Full Article

Sector Primer Series: Energy

Contributor Image
Louis Bellucci

Senior Director, Index Governance

S&P Dow Jones Indices

INTRODUCTION

The Global Industry Classification Standard® (GICS®) assigns a company to business classifications, such as the Energy sector, according to its principal business activities.  Sector is the first level of the four-tiered, hierarchical industry classification system that includes 11 sectors, 24 industry groups, 69 industries, and 158 sub-industries.  The GICS assignment system uses quantitative and qualitative factors, including revenues, earnings, and market perception.  GICS was developed in 1999 and is jointly managed by S&P Dow Jones Indices and MSCI.

The Energy sector comprises companies primarily engaged in:

  • Oil and gas exploration, production, refining, marketing, storage, and transportation;
  • Contracted drilling or ownership of drilling rigs that contract their services for drilling wells;
  • Manufacturing equipment, including drilling rigs, and providing supplies and services to companies involved in the drilling, evaluation, and completion of oil and gas wells; and
  • Production and mining of coal, related products, and other consumable fuels related to the generation of energy.

COMPOSITION

The S&P 500® Energy includes all companies in the S&P 500 that are assigned to the Energy sector by GICS.  Created in 1957, the S&P 500 was the first broad U.S. market-cap-weighted stock market index.  Today, it is the basis of many listed and over-the-counter investment instruments.

The Energy sector is the eighth most heavily weighted of the 11 sectors within the S&P 500.  As of Dec. 31, 2018, the sector represented 5.32% of the S&P 500 (see Exhibit 2).

There is a lower exposure to Energy in the mid- and small-cap indices, with the ninth heaviest sector weight in the S&P MidCap 400® and S&P SmallCap 600®, at 3.74% and 3.43%, respectively.  Overall, in the S&P Total Market Index, which consists of over 3,800 stocks—including those in the S&P 500, S&P MidCap 400, S&P SmallCap 600, and micro caps— Energy was the eighth largest sector, with 210 securities and a weight of 4.99%.

Thirty companies, with a total float-adjusted market capitalization of USD 1,117.72 billion, comprised the S&P 500 Energy as of Dec. 31, 2018.  The two largest companies in the sector were Exxon Mobil Corp (XOM) and Chevron Corp (CVX), with float-adjusted market caps of USD 288.70 billion and USD 207.87 billion, translating to S&P 500 weights of 1.37% and 0.99%, respectively.  XOM was the ninth largest weight in the S&P 500.  The mean market cap of S&P 500 Energy stocks was USD 37.26 billion, the median market cap was USD 21.35 billion, and the minimum market cap was USD 2.94 billion.  The top 10 Energy holdings made up 76.37% of the sector.  Exhibit 4 shows that the Energy sector was the second most concentrated in its top 10 components among the 11 GICS sectors. 

pdf-icon PD F Download Full Article

Sector Primer Series: Consumer Staples

Contributor Image
Louis Bellucci

Senior Director, Index Governance

S&P Dow Jones Indices

INTRODUCTION

The Global Industry Classification Standard® (GICS®) assigns companies to business classifications, such as the Consumer Staples sector, according to their principal business activities. The sector is the first level of the fourtiered, hierarchical industry classification system that includes 11 sectors, 24 industry groups, 69 industries, and 158 sub-industries. The GICS assignment system uses quantitative and qualitative factors, including revenues, earnings, and market perception. GICS was developed in 1999 and is jointly managed by S&P Dow Jones Indices and MSCI.

The Consumer Staples sector comprises companies primarily engaged in:

  • Food and staples retailing and distribution, such as owners and operators of hypermarkets, super centers, and pharmacies;
  • Producing food, beverage, and tobacco products; and
  • Manufacturing household and personal products, such as detergents, soaps, diapers, cosmetics, and perfumes.

COMPOSITION

The S&P 500® Consumer Staples includes all companies in the S&P 500 that are assigned to the Consumer Staples sector by GICS.  Created in 1957, the S&P 500 was the first broad U.S. market-cap-weighted stock market index.  Today, it is the basis of many listed and over-the-counter investment instruments.

The Consumer Staples sector is the seventh most heavily weighted of the 11 sectors within the S&P 500.  As of Dec. 31, 2018, the sector represented 7.41% of the S&P 500 (see Exhibit 2). 

There is a lower exposure to Consumer Staples in the mid- and small-cap indices, with the tenth-heaviest sector weight in the S&P MidCap 400® and eighth-heaviest in the S&P SmallCap 600®, at 2.94% and 3.58%, respectively.  Overall, in the S&P Total Market Index, which consists of over

3,800 stocks—including those in the S&P 500, S&P MidCap 400, S&P SmallCap 600, and micro caps—Consumer Staples was the seventh largest sector, with 136 securities and a weight of 6.64%.

Thirty-three companies, with a total float-adjusted market capitalization of USD 1,558.02 billion, comprised the S&P 500 Consumer Staples as of Dec.31, 2018.  The two largest companies in the sector were Procter & Gamble (PG) and Coca-Cola Co (KO), with float-adjusted market caps of USD 229.01 billion and USD 181.39 billion, translating to S&P 500 weights of 1.09% and 0.86%, respectively.  There were no Consumer Staples companies in the top 10 constituents of the S&P 500—Procter & Gamble ranked as the 14th largest.  The mean market cap of S&P 500 Consumer Staples stocks was USD 47.21 billion, the median market cap was USD 22.97 billion, and the minimum market cap was USD 2.96 billion.  The top 10 Consumer Staples holdings made up 73.78% of the sector.  Exhibit 4 shows that the Consumer Staples sector was the third most concentrated in its top 10 components among the 11 GICS sectors.

pdf-icon PD F Download Full Article

TalkingPoints: Expanding the Equity Opportunity Set in New Zealand

Contributor Image
Michael Orzano

Senior Director, Global Equity Indices

S&P Dow Jones Indices

The S&P/NZX Emerging Opportunities Index reaches beyond the S&P/NZX 50 Index to capture a unique mix of investable small- and mid-sized New Zealand companies.

  1. Why is this index being introduced now?

As the principal broad market equity benchmark in New Zealand, the 

S&P/NZX 50 Index defines the investable opportunity set for New Zealand fund managers. Our latest addition to the S&P/NZX Series, the S&P/NZX Emerging Opportunities Index takes an innovative approach to defining small- and mid-cap companies by including the smaller members of the S&P/NZX MidCap Index and the largest, most liquid members of the S&PNZX SmallCap Index. In doing so, it  reaches beyond the S&P/NZX 50 Index, expanding the opportunity set while still utilizing size and liquidity criteria to support investability.

  1. How does the index work?

The eligible universe is defined as constituents of the S&P/NZX All Index that are not members of the S&P/NZX 20 Index.  Minimum float market cap and median daily value traded thresholds of NZD 100 million and NZD 35,000, respectively, are required for inclusion. In addition, maximum total and float-adjusted market cap thresholds of NZD 1.5 billion and NZD 1 billion, respectively, are employed in order to ensure relatively large companies are excluded. The index is weighted by float-adjusted market cap and is rebalanced quarterly, in line with other S&P/NZX equity indices.

  1. How can the index be used?

The index is designed to be a complement to the S&P/NZX 20 Index, which comprises 20 of the largest, most liquid New Zealand companies. When used in tandem, the two indices essentially capture the entire investable market in New Zealand. The index is intended for use as a benchmark for small- and mid-cap investment strategies or as an underlying index for passive investment products.

  1. What are some unique characteristics of the index?

The S&P/NZX Emerging Opportunities Index has a meaningfully different size profile compared with the existing S&P/NZX size indices and the S&P/NZX 50 Index. As depicted in Exhibit 2, the weighted average total market cap of the index is less than one-third that of the S&P/NZX MidCap Index and more than double that of the S&P/NZX SmallCap Index. Unsurprisingly, it is far smaller than the S&P/NZX 50 Index or S&P/NZX 20 Index, which are heavily weighted to the largest New Zealand companies.

pdf-icon PD F Download Full Article

Why Taking a Local Approach to Index Construction Matters in Canada

Contributor Image
Michael Orzano

Senior Director, Global Equity Indices

S&P Dow Jones Indices

While nearly everyone in the Canadian investment community has heard of  the S&P/TSX Composite, few are aware of the key methodological Senior Director intricacies that distinguish it from other broad market Canadian equity benchmarks.

The most notable distinction is that the S&P/TSX Composite is designed specifically for Canadians (as are all S&P/TSX Indices), while many other Canadian equity indices, such as the FTSE Canada All Cap Index, are simply country slices of global benchmarks and, therefore, take the perspective of foreign investors.  Why might this matter?  Canada has foreign ownership limits that affect several industries, such as telecommunications, broadcasting, transportation, and real estate.  Therefore, whether or not these limits are accounted for in the index is significant.

As an example, Bell Canada (BCE)—the largest Canadian telecommunications company—was the 10th largest company in the S&P/TSX Composite, with a weight of 2.3%, as of June 28, 2019 (see Exhibit 1).  However, foreign investors are restricted from owning more than one-third of BCE under Canada’s Telecommunications Act.  As a result, BCE’s weight in the FTSE Canada All Cap Index is reduced by two-thirds from its natural market-cap weighting to roughly 0.75%.

pdf-icon PD F Download Full Article

Processing ...