


Given gold’s strong bull run since 2022, its increase in popularity is no surprise. As of year-end 2024, gold is the best-performing asset class in the 21st century, and, since 2022, the S&P GSCI Gold has increased over 119%.
Despite a correction in the latter half of October 2025, gold’s role as a safe-haven asset remains intact. Trade tensions between China and the U.S., eurozone instability and a weak dollar have continued to spur both central bank buying and record flows into physical gold-backed ETFs.
In this paper, we will review the differences between physical and synthetic gold ETPs and some on-the-shelf solutions offered by S&P Dow Jones Indices (S&P DJI).
S&P DJI offers three investable measurements of the gold market: (1) the S&P Commodity Producers Gold Index, (2) the S&P GSCI Physical Gold Index and (3) the S&P GSCI Gold.
Exhibit 1 shows the rebased performance of each index as of October 2025. The outperformance of the equities-based index is apparent and in line with recent equities exceptionalism. However, as gold is often sought out as a hedge and diversifier against both inflation and equities, it’s important to note that the S&P Commodity Producers Gold Index is 27% correlated with the S&P 500® TR.
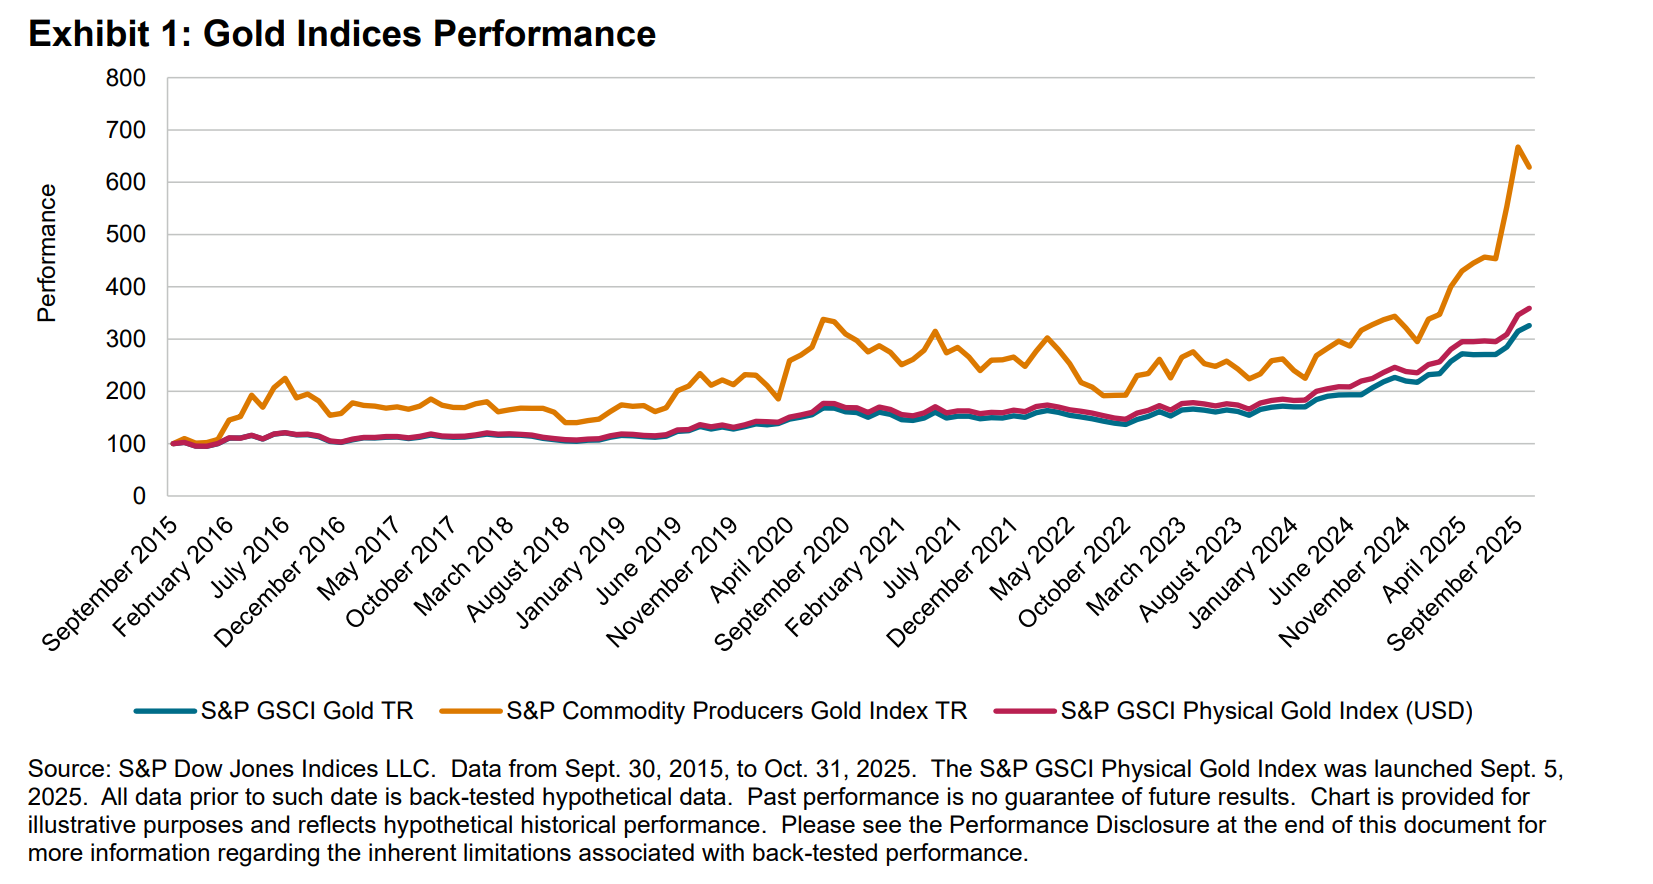
Additionally, equity-based commodities are heavily affected by company performance outside of the precious metal; the S&P Commodity Producers Gold Index is only 84% correlated with the S&P GSCI Physical Gold Index, S&P DJI’s spot index.
Also apparent in Exhibit 1 is the strong correlation in performance between the S&P GSCI Physical Gold Index and the S&P GSCI Gold, which is 98% as of October 2025. Exhibit 2 shows the similarity in the performance of the S&P GSCI Gold (futures-based) and SPDR GLD, the largest physically backed gold ETP to date. Across the 3-, 5- and 10-year tenors, the difference in Sharpe ratios between the two is negligible.
