IN THIS LIST

A Guide to S&P Decrement Indices

Indexing Liquid Alternatives

Talking Points: Capturing the Growth of the Australian Technology Industry

The S&P/B3 Brazil ESG Index: A New Benchmark for Sustainability and Investment

FAQ: S&P IPSA ESG Tilted Index

A Guide to S&P Decrement Indices

Contributor Image
Izzy Wang

Analyst, Strategy Indices

INTRODUCTION

Decrement indices have gained popularity as the underlying assets of equity-linked structured products in Europe and Asia. According to Structured Retail Products, among the 318 products across asset classes in France that matured or autocalled between April 2018 and March 2019, more than 32 were linked to decrement indices.

One of the reasons behind this recent popularity is the low interest rate environment that has emerged since the 2008 Global Financial Crisis, which has posed challenges for structured product issuers to design attractive products. This environment triggered a search for new underlying assets or strategies that might deliver cheaper optionality. Decrement indices aim to provide a solution to this challenge. S&P DJI has developed a flexible, transparent, and rules-based decrement index framework, which features:

  • Globally accepted, independent underlying indices such as the S&P 500®;
  • Transparent methodology based on the S&P DJI decrement framework; and
  • Customization options in underlying index and decrement parameters.

A Guide to S&P Decrement Indices: Exhibit 1

How Decrement Indices Work

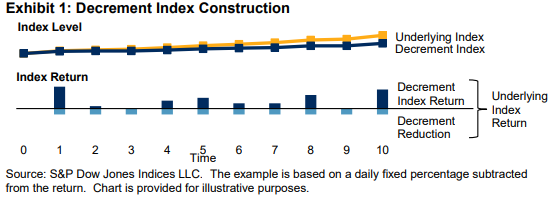
A decrement is an overlay applied to an underlying index. It is constructed by periodically deducting a predefined fee, either in the form of a fixed percentage or index points, from the underlying index (see Exhibit 1).

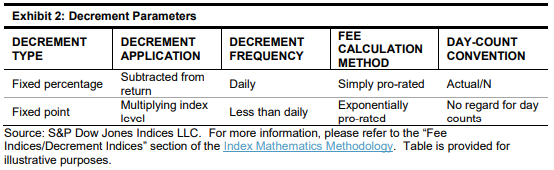
Given an underlying index, decrement indices can be calculated in different ways, depending on which parameters are chosen (see Exhibit 2). All the parameters can be customized. Decrement type and application are the most important parameters, as they primarily determine the amount of decrement deduction and how it is applied to an underlying index.

A Guide to S&P Decrement Indices: Exhibit 2


Decrement Type

The performance reduction applied to an underlying index can be either fixed percentage or fixed point. The logic of the fixed-percentage decrement is that dividend yield tends to be stable over the long term. During the past 10 years, the trailing 12-month dividend yield for the S&P 500 was relatively stable, at about 2%. On the other hand, a fixed-point deduction assumes a relatively high level of stability in dividend amounts in the short term, as companies are inclined to maintain more stable dividend policies compared with their earnings.

pdf-icon PD F Download Full Article

Indexing Liquid Alternatives

Contributor Image
Rupert Watts

Senior Director, Strategy Indices

Contributor Image
Fiona Boal

Managing Director, Global Head of Equities

Contributor Image
Phillip Brzenk

Managing Director, Global Head of Multi-Asset Indices

INTRODUCTION

Alternative investment strategies, including absolute return long-short, risk parity, global macro, or relative value, have historically been used only by the most sophisticated market participants, such as institutional investors and hedge funds.  Market participants often seek alternative investments to improve diversification in portfolios, since these strategies tend to exhibit low correlations to the more traditional financial market asset classes of equities and fixed income.  Better diversification may lead to higher risk-adjusted returns and lower drawdowns in a portfolio relative to one that only holds stocks and bonds.

However, a drawback of some alternative investments is that they can be relatively illiquid and only appropriate for long-term investment horizons without short-term liquidity needs.  Conversely, investing in alternative strategies through liquid instruments, such as exchange-traded futures contracts, can reduce the illiquidity risk, making them a good fit for a broader range of market participants.  These strategies, commonly referred to as liquid alternatives, give market participants better access to alternative investments.  Additionally, liquid alternatives in an index format provide a systematic rules-based methodology, transparency in pricing, and typically lower cost structure.

There is a wide range of liquid alternative strategies with differing characteristics or key properties as the underlying rationale for construction.  A liquid alternative strategy could vary from directional to market neutral to trend following.  Directional strategies are typically long-only with low-to-moderate correlation to broad equities, seeking higher risk-adjusted returns relative to the market over the long term.  Market-neutral strategies seek to provide purer exposure to certain risk premia in the marketplace by stripping out the market beta.  These are typically long-short and target a zero beta, and thus tend to exhibit a low correlation to broad equities.  A trend-following strategy seeks to capture price trends by going long or short different assets based on recent price movements, and its correlation to broad equities varies from positive to negative over time.  To have a large opportunity set and proper diversification, a trend-following strategy often incorporates multiple asset classes, such as equities, fixed income, currency, and commodities.

pdf-icon PD F Download Full Article

Talking Points: Capturing the Growth of the Australian Technology Industry

Contributor Image
Michael Orzano

Senior Director, Global Equity Indices

The S&P/ASX All Technology Index highlights a unique and innovative segment of the Australian market.

  1. Why was this index introduced?

In recent years, ASX-listed technology companies have experienced substantial growth in terms of both number of companies and market capitalization. In the past six years, the number of S&P/ASX All Technology Index constituents nearly tripled from 24 to 69, while the total market capitalization of these companies increased tenfold from AUD 17 billion to about AUD 170 billion.

In a market heavily concentrated in banks and natural resource companies, there is significant demand for an index that captures the Australian technology sector in a comprehensive yet precise way. Importantly, the technology segment measures a unique, innovative part of the market that remains a small portion of the broader Australian share universe. We also expect the index to increase the visibility of technology-related businesses listed on the ASX, which should support further growth of the sector over time.

pdf-icon PD F Download Full Article

The S&P/B3 Brazil ESG Index: A New Benchmark for Sustainability and Investment

Contributor Image
María Sánchez

Director, Sustainability Indices Product Management, Latin America

INTRODUCTION

Indices that integrate environmental, social, and governance (ESG) data are moving from the margins to the mainstream, as investors increasingly seek to align their values with their investments.  A new type of ESG index is emerging to facilitate this change in Brazil: the S&P/B3 Brazil ESG Index.  Jointly developed by S&P Dow Jones Indices (S&P DJI) and the Brazilian stock exchange (Brasil Bolsa Balcão [B3]), this index not only highlights strong ESG companies—as ESG indices have traditionally done—but it also enables allocation to such companies without requiring investors to take on major risks relative to the market.

THE EVOLUTION OF ESG INDICES

In 1999, S&P DJI launched the first global ESG index, the Dow Jones SustainabilityTM World Index (DJSI World).  By including the top 10% of companies, industry by industry, according to their ESG performance, as determined by the Corporate Sustainability Assessment (CSA) conducted by S&P Global, this groundbreaking index encouraged companies to incorporate many ESG factors in their decisions, extending beyond short-term financial considerations.

In the years that followed, other indices, including regional versions of the DJSI World, such as the DJSI Emerging Markets, were launched with this same philosophy in mind: to highlight best-in-class companies and thereby inspire companies to improve their ESG approaches in order to qualify for inclusion in these indices.

Though these indices have been successful and have indeed inspired companies to change in positive ways, aspects of their methodologies present challenges for many investors.  Some strategies can be too narrow for investors who want to remain broadly diversified.  Though many high-conviction investors use the narrow, best-in-class indices for investment, we saw a need from market participants for ESG indices with the potential to provide returns more in line with the broader market, while providing a more sustainable portfolio of companies.  An example of an index that launched in 2019 that typifies this investor-oriented methodology is the S&P 500® ESG Index.

With the launch of the S&P/B3 Brazil ESG Index, Brazil now has an investor-oriented ESG index of its own.  This index maintains a large portion of the companies in its underlying index, the S&P Brazil BMI, thereby staying broad and diverse while still screening out companies involved in certain business activities and controversies, as well as those with sustainability profiles that run counter to ESG investors’ preferences.

pdf-icon PD F Download Full Article

FAQ: S&P IPSA ESG Tilted Index

COMPANY BACKGROUND

  1. Who is S&P Dow Jones Indices?  S&P Dow Jones Indices (S&P DJI) is home to iconic financial market indicators, such as the S&P 500® and the Dow Jones Industrial Average®. The largest global resource for essential index-based market concepts, data, and research, it is a major investor resource to measure and trade the markets.

    S&P Dow Jones Indices has been a pioneer in environmental, social, and governance (ESG) indexing for 20 years, starting with the 1999 launch of the Dow Jones Sustainability World Index. Today, we offer an extensive range of indices to fit varying risk/return and ESG expectations, from core ESG and low-carbon climate approaches, to thematic and fixed income ESG strategies.

  2. Who is SAM?  SAM, was founded in 1995 and has been a partner of the S&P Dow Jones Indices since 1999, when they worked together to launch the Dow Jones Sustainability Index (DJSI) Series. SAM provides ESG Research and Benchmarking and conducts the annual SAM Corporate Sustainability Assessment (CSA). SAM was formerly a part of asset mananger RobescoSAM. In January 2020, it became a part of S&P Global.

S&P IPSA ESG TILTED INDEX

  1. What is the S&P IPSA ESG Tilted Index? The S&P IPSA ESG Tilted Index is designed to measure the performance of eligible securities in the S&P IPSA that meet sustainability criteria, while attempting to improve the overall S&P DJI ESG Score with respect to the S&P IPSA by overweighting or underweighting ("tilting") companies based on their S&P DJI ESG Scores.
  2. What are the S&P DJI ESG Scores? S&P DJI ESG Scores are environmental, social, and governance scores that robustly measure ESG risk and performance factors for corporations, with a focus on financial materiality. The S&P DJI ESG Scores are used in the constituent weighting process in the S&P IPSA ESG Tilted Index. They are a second set of ESG scores calculated by SAM, in addition to the S&P Global ESG Scores (formerly known as SAM ESG Scores) that are used to define the Dow Jones Sustainability Indices constituents.

    The S&P DJI ESG Scores are the result of some further scoring methodology refinements to the S&P Global ESG Scores. They are based on SAM’s annual Corporate Sustainability Assessment (CSA), a bottom-up research process that aggregates underlying company ESG data to score levels. The scores contain a total company-level ESG score for a financial year, comprising individual environmental (E), social (S), and governance (G) dimension scores, beneath which there are on average 21 industry-specific criteria scores that can be used as specific ESG signals (see Exhibit 1).

  3. FAQ: S&P IPSA ESG Tilted Index: Exhibit 1

    A company’s total ESG score is the weighted average of all criteria scores and their respective weights. Each individual ESG dimension score (e.g., a company’s “E” score) is the weighted average of all criteria scores and weights within a specific ESG dimension. Total ESG scores range from 0-100, with 100 representing best performance.

pdf-icon PD F Download Full Article

Processing ...