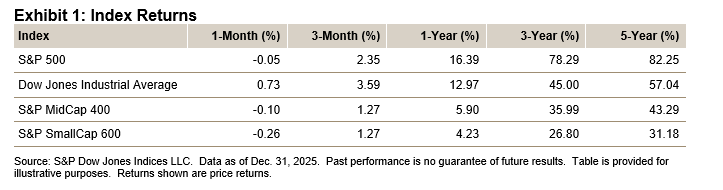
IN THIS LIST

U.S. Equities Market Attributes August 2023

U.S. Equities Market Attributes July 2023

S&P Kensho New Economies Commentary: Q2 2023

Multi-Asset Survey: What's Driving Demand for Multi-Asset Indices

iBoxx Tadawul SAR Government Sukuk Indices – Q2 2023

U.S. Equities Market Attributes August 2023

Contributor Image
Howard Silverblatt

Senior Index Analyst, Product Management

S&P Dow Jones Indices

Key Highlights

Exhibit 1: Index Returns - U.S. Equities August 2023

MARKET SNAPSHOT

The June and July celebration (the S&P 500 was up 9.79% over the two months) of the end of Fed interest rate increases, along with the expected start of cuts and end of inflation, came to an end in August, as the market started to focus on the potential of higher interest rates for a longer time period, fueled by a stronger economy (which is being fed by a spending consumer and spending government).  That concern resulted in a 4.78% decline from Aug. 1-18, as some profit-taking and reallocation appeared to add to the fall.  From that point, economic data (i.e., housing, JOLTS and employment reports) painted a slowdown in growth, and the market increased 3.16%, with the month ending down 1.77%. Breadth improved but remained negative for the month (350 down and 153 up for August compared to 54 down and 449 up for June and July).  

For both time periods, the market seemed to be testing its level, looking for its support point with higher volatility (intraday high/low went up to 1.01% from July’s 0.68% and was the highest since March’s 1.51%).  The testing is expected to continue next month on an issue level as analysts review their Q4 2023 and 2024 projections ahead of the Fed's Sept. 19-20 meeting.  The market (according to futures) is pegging an 89% chance of no change, which becomes a 38% chance of a 0.25% increase at the Nov. 1 meeting.  On the bright side of an increase, the market is fully prepared to accept a 0.25% increase, as long as the verbiage indicates that it is the last one.  Overall, volatility is expected to increase and differentiate based on industry and issue projections, with any Fed action or commentary raising or lowering all boats.  

Of note, current political events have not yet had a significant impact on the market, possibly because the election is 16 months away.  Also of note, September is historically the worst-performing month of the year (from 1928), going up only 44% of the time (-9.35% in September 2022, -4.76% in 2021 and -3.99% in 2020), with an average decline of 1.12%.

For August, the S&P 500 closed at 4,507.66, down 1.77% (-1.59% with dividends) from July's close of 4,588.96, when it was up 3.11% (3.21%).  For the three-month period, the index was up 7.84% (8.28%), as the YTD return was 17.40% (18.73%) and the one-year return was 13.97% (15.94%).  The 2022 return was -19.44% (-18.11%), 2021 was up 26.89% (28.71%), 2020 was up 16.26% (18.40%), 2019 was up 28.88% (31.49%) and 2018 was down 6.24% (4.38%).  The index was down 6.02% (-3.39%) from its Jan. 3, 2022, closing high and up 33.12% (41.00%) from its pre-COVID-19 Feb. 19, 2020, closing high.  Monthly intraday volatility (daily high/low) increased to 1.01% from last month’s 0.68% (0.88% in June, 0.96% in May) and was 1.09% YTD.

S&P 500 trading increased 1% (adjusted for trading days) for August, after being down 10% in July and up 4% in June, as the year-over-year rate was up 12% over August 2022.  The August 2023 12-month trading volume was up 16% over the prior period, after full-year 2022’s 6% increase.  In August, 5 of the 23 trading days moved at least 1% (2 up and 3 down), as none of the 20 trading days in July moved at least 1% and 4 of the 22 days in June moved at least 1% (all 4 up).  Year-to-date, 46 of the 167 days moved at least 1% (27 up and 19 down), and 2 moved at least 2% (1 up and 1 down).  Of the 23 trading days in August, 12 had a high/low intraday spread of at least 1% and none of at least 2% (last month, 2 of the 21 trading days had a spread of at least 1% and none with at least 2%).  Year-to-date, there were 80 intraday moves of at least 1%, 12 of at least 2% and none of at least 3% (the last 3% move was on Nov. 30, 2022).  The Dow Jones Industrial Average ended the month at 34,721.91, down 2.36% (-2.01% with dividends) from last month’s close of 35,559.53, when it was up 3.35% (3.44%) from the prior month’s close of 34,407.60 (4.56%, 4.68%).  The Dow® was down 5.65% from its Jan. 4, 2022, closing high of 36,799.65.  The three-month return was 5.51% (6.10% with dividends), as the YTD return was 4.75% (6.37%), the one-year return was 10.19% (12.58%) and the 2022 return was -8.78% (-6.86%).

pdf-icon PD F Download Full Article

U.S. Equities Market Attributes July 2023

Contributor Image
Howard Silverblatt

Senior Index Analyst, Product Management

S&P Dow Jones Indices

Key Highlights

Exhibit 1: Index Returns - U.S. Equities July 2023

MARKET SNAPSHOT

The market continued up in July, as earnings met their slightly lowered expectations and were nowhere near a recession—let’s say it was a “noticeable slowdown,” which is the term U.S. Fed Chair Jerome Powell used when he said the U.S. Federal Reserve no longer expected a recession.  The economic outlook improved, as consumers remained strong (but more selective), and earnings came in better, with forward estimates showing growth.  The Street, however, seemed to be split on the chances of a recession.  The FOMC raised interest rates by 0.25%, and the Street was also split on whether the Fed will do another interest rate hike, with the good news being that it seems to have accepted if the Fed does “one for the road,” as long as it’s a farewell hike; the Street also expects 2024 to be the year of the cut (“don’t expect and you won’t be disappointed,” but expectations are what make trades).

A key trading takeaway for the month was the broadening of returns, as breadth declined but remained strong.  For June and July, the S&P 500 TR was up 10.03% (6.61% in June and 3.21% in July).  The top 10 issues contributed 34.4%.  Gone are the days when 8 issues (7 companies) accounted for all the gains (excluding them, the market would have been negative), as it now takes 331 issues to negate the index for the period after May 31, 2023.  Not that size doesn’t count (Apple, NVIDIA and Tesla still headed the June-July list, accounting for 19% of the gains, as Information Technology accounted for 24.5%), but the broad gains helped feed the hope for a full recovery.  Of course, the catch-up from the new smaller grunts doing the work and some profit-taking from the big guys has taken a little away from the recovery view.  If the trend continues, and if the top is already saturated and fully priced, their contribution will slowly decline in the YTD stats, but for full-year 2023, absent a top belt down, the year should still show a top-heavy contribution list, due to the opening five-month performance.

For July, the S&P 500 closed at 4,588.96, up 3.11% (3.21% with dividends) from last month's close of 4,450.38, when it was up 6.47% (6.61%).  For the three-month period, the index was up 10.06% (10.51%), while the YTD return was up 19.52% (20.65%) and the one-year return was 11.11% (13.02%).  For the month, all 11 sectors gained, just like they did in June, up from 3 in May and 8 in April.  Energy did the best, gaining 7.28% (down 0.50% YTD and up 58.25% from the 2021 close), and Health Care did the worst, up 0.85% (down 1.49% YTD and down 4.99% from the close of 2021).  Breadth for the month decreased but stayed strongly positive, as 362 issues were up (454 last month and 124 the month before that), with 77 (152, 32) issues up at least 10% and 7 (20, 7) up at least 20%, while 141 (49, 379) declined, with 12 (3, 91) declining at least 10% and none (0, 11) down at least 20%.  Year-to-date, breadth increased, as 329 (300 last month) issues were up, with 221 issues up at least 10% and 129 up at least 20%, as 174 (203) were down, with 72 issues down at least 10% and 19 down at least 20%.  On an aggregate basis, the S&P 500 increased USD 1.107 trillion (up USD 6.742 trillion YTD) to USD 38.269 trillion (it declined USD 8.224 trillion for 2022).  It was up USD 910.205 trillion from the Feb. 19, 2020, start of the COVID-19 pandemic.

As for August, trading tends to slow down and the streets get hot (hard to believe after last week’s heat wave), as many leave for summer vacation (given the current foot traffic downtown, that might leave no one—even the food trucks are few).  It is, however, a great time to visit Washington, which is not expected to be as hot, given the Senate is in recess until Sept. 5 and the House until Sept. 12 (although closed door work on the next crisis situation—the budget—will be going on).  Earnings should continue to dominate the first half of the month, as retail also declares and lets us know how much we have spent (and where).  The first presidential debate for the Republican party is Aug. 23, and the Jackson Hole symposium (Aug. 24-26) theme is “Structural Shifts in the Global Economy,” though the Street seems more interested in the Fed’s Sept. 19-20 meeting, and what (and when) new bank requirements will be implemented.

pdf-icon PD F Download Full Article

S&P Kensho New Economies Commentary: Q2 2023

The S&P Kensho New Economy Indices seek to track the industries and innovation of the Fourth Industrial Revolution

Equities performance in the second quarter of 2023 was strong considering the macro risks that plagued the markets at the start of the quarter.  The specter of U.S. debt-ceiling brinkmanship caused some market jitters, but the issues were resolved, as expected, without much damage to U.S. Treasury yields or global equities markets.  Aside from the risk surrounding this event, investors maintained their focus on the more mid-term factors of the U.S. Fed interest rate trajectory and macro data to discern the odds of a recession in the coming quarters.  The Fed’s decision to pause its rate hiking cycle was followed up with an increase in its estimates of year-end economic growth and inflation numbers, reiterating its hawkish stance.  The markets did take notice, as expectations for year-end interest rate levels increased, though they were lower than the Fed’s own expected year-end rate.  Both sides have data supporting their views.  A negatively sloped U.S. Treasury yield curve, tightening lending standards in the aftermath of the Silicon Valley Bank (SVB) failure, moderating inflation prints and expectations for a weak corporate earnings season argue for an earlier stop to the Fed rate hikes.  On the other hand, robust consumer spending, continued strength in jobs and wages data, lower energy prices and persistent core inflation could keep the Fed on its planned rate hike path.  As investors wait on macro data in the coming months to get more clarity on the Fed’s eventual path, they appear to hold plenty of cash on hand.  Fund flows data show another round of strong inflows (USD 174 billion) in money market funds, adding to the remarkable USD 424 billion of inflows during the first quarter at the height of the SVB fallout. 

Global equities (S&P Global BMI) were up 6%, with both developed markets ex-U.S. (2.2%) and emerging markets (1.3%) contributing positively.  Stabilized oil prices and moderating inflation were tailwinds for eurozone equities, although they underperformed the U.S. this quarter.  Emerging market equities performance was subdued, as expectations of a Chinese consumption boom post-lockdowns continue to be downgraded.  U.S. equities (S&P 1500™) posted positive performance (8.4%) across the large-, mid- and small-cap segments.  The S&P 500® extended its previous quarter’s recovery, gaining in Q2 (8.7%), and the index was technically back in bull market territory, picking up 24% from the low of October 2022.  The drivers of this recovery, however, were narrow in the so-called “magnificent seven” (Apple, Amazon, Alphabet, Meta, Microsoft, Nvidia and Tesla) that contributed nearly 5.6% of this quarter’s gains, while the Information Technology sector drove more than half of the index gains.  The dash toward growth-tilted stocks continued the growth-versus-value outperformance trend this quarter (4%).  Low volatility and various dividend strategies were the primary negative-performing factors, albeit by a narrow margin.  VIX® touched its lowest levels since the start of the pandemic and continues to be at odds with its bond market equivalent.  The S&P Kensho New Economies Composite Index was up (4.6%) for the second consecutive quarter and remained within its one-year range.  A strong showing from growth and technology stocks was reflected across the index’s performance as well; 16 of the 25 subsectors posted positive returns, with defensive-tilted Sustainable Farming, Digital Health and Clean Energy among the weaker performers.

Fixed income markets were generally down over the quarter, as central banks maintained their hawkish stance for the most part.  Rising yields coincided with negative quarterly returns in the various U.S. Treasury indices, especially in the longer duration versions (-1.5% for the S&P U.S. Treasury Bond 7-10 Year).  The iBoxx USD Liquid High Yield (1.3%) outperformed its high-grade counterpart (-0.04%), partly due to its shorter duration profile, as the interest rate curve fell further into negative territory.  Commodities were down (‑2.7%) this quarter, especially within the industrial metals (-9%) and energy (-3.2%) spaces.  Oil was modestly lower (-7%) on the back of concerns of a global growth outlook, while natural gas recovered partially (26%) but was still down considerably YTD.  Gold gave up some of its first quarter returns (-3%) with the extension of the U.S. debt ceiling debate, while the U.S. dollar was relatively unchanged this quarter.

pdf-icon PD F Download Full Article

Multi-Asset Survey: What's Driving Demand for Multi-Asset Indices

A multi-asset approach that is nimble while targeting higher quality and more liquid assets is the priority for asset owners and managers as they look to tackle volatility and uncertainty for the rest of 2023, finds the latest poll by AsianInvestor and S&P Dow Jones Indices (S&P DJI).

Adapting to uncertain times

As macro, market and geopolitical headwinds continue to ebb and flow, several common asset allocation themes are shaping investment strategies across Asia. At the same time – accentuating the challenges for portfolio planning amid such an unpredictable outlook – investor opinion is divided on some key considerations.

For example, while long-term capital growth is expected to be the main driver for allocation decisions over the next six months, investors want to be flexible and active in their tactical asset selection.

Further, in eyeing multi-asset exposure, different allocators have different priorities. As they look to manage volatility and achieve absolute returns, their key considerations when selecting a multi-asset strategy range from its ability to stay aligned with the defined investment goal, to its track record, to its performance over the benchmark.

Yet in the search for consistent and attractive risk-adjusted returns during the rest of 2023, there is consensus in terms of a preference for high-quality fixed income, across global, Asian and US investment grade (IG) bonds. Investors also want to stay liquid, whether via alternatives or cash.

These were some of the exclusive insights from 101 senior executives at leading asset owners and investment managers in 11 markets across Asia, gathered in May and June 2023 by AsianInvestor in collaboration with S&P DJI. Respondents included insurance companies, public and private pension funds, sovereign wealth funds, government entities, endowments, family offices and asset managers – from Hong Kong, Taiwan, Australia, South Korea, Japan, Singapore, Thailand, Malaysia, Indonesia, the Philippines and India.

pdf-icon PD F Download Full Article

iBoxx Tadawul SAR Government Sukuk Indices – Q2 2023

Contributor Image
Paulina Lichwa-Garcia

Associate Director, Fixed Income Indices

S&P Dow Jones Indices

iBoxx Tadawul SAR Government Sukuk Index

The iBoxx Tadawul SAR Government Sukuk Index total return level saw less volatility compared to the two previous quarters, staying in a narrow range between 103 and 106 for the entire quarter.  Index duration continued to fall, alongside the number of bonds.  The index closed the quarter with 51 constituents, compared with 52 at the end of second quarter and 53 at the start of the year.  Annual yields dipped at the start of the quarter but shifted to an upward trajectory in June.

iBoxx Tadawul SAR Government Sukuk Indices: Exhibit 1

iBoxx Tadawul SAR Government Sukuk Indices: Exhibit 2

iBoxx Tadawul SAR Government Sukuk Indices: Exhibit 3

pdf-icon PD F Download Full Article

Processing ...