


Key Highlights
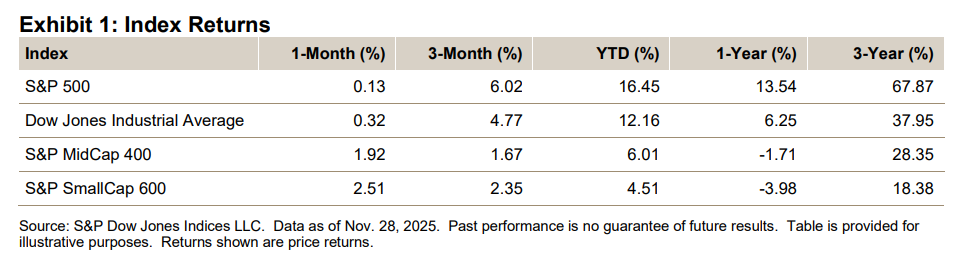
- The S&P 500® was up 0.13% in November, bringing its YTD performance to 16.45%.
- The Dow Jones Industrial Average® gained 0.32% for the month and was up 12.16% YTD.
- The S&P MidCap 400® increased 1.92% for the month, bringing its YTD level to 6.01%.
- The S&P SmallCap 600® gained 2.51% in November and was up 4.51% YTD.
Market Snapshot
The S&P 500 reversed course for most of November, as concern over forward growth, costs, market multiples and growing AI-related debt levels combined for some profit taking. Sellers, who have been less active this year (relative to buyers and inflows), came in and overpowered buyers for most of the month, as buy-on-the-dip investors defended several support levels to limit the decline, and then emerged victorious, turning the month positive on the last day of the month, with a 0.13% gain, which left the index up 16.45% YTD (after a gain of 23.31% in 2024 and 24.23% in 2023). Breadth turned positive, though the index failed to post a new closing high for the first month since May 2025 (there have been 36 YTD). The Dow Jones Industrial Average, however, did post a new closing high in November (48,431.57 intraday high and 48,254.82 closing high), as it closed over 48,000 for the first time, posting a 0.32% gain for the month and up 12.16% YTD (6.25% for the one-year period).
Operating earnings (with 96% reporting) came in significantly stronger than estimated and are expected to post a quarterly record of USD 618 billion (the prior record is Q2 2025 at USD 543 billion). Sales, which were initially expected to decline, increased and were also expected to set a new quarterly record, at USD 4.53 trillion (the prior record is Q2 2025 at USD 4.35 trillion), with margins also on the verge of a new record, at 13.62% (the prior record is Q2 2021 at 13.54%). Tariff news continued to be volatile, with agreements coming in at a 15% level, as U.S.-China negotiations continued. The market traded down most of the month, though the last few days saw selling decline, as buyers came in and pushed the market into the black.
Momentum in November shifted to Health Care issues, as the sector posted a broad 9.14% gain (its best since October 2022’s 9.59% gain), even with the potential of 24 million Americans losing subsidies for the Affordable Care Act’s premiums at the end of 2025. Health Care had underperformed the index since the close of 2022 (up 15.29% from now, compared to when it was up 2.11% at the end of Q3 2025). On the other side of the coin was selling in Information Technology, after built-up gains over the past few years (up 29.30% going into November, up 35.69% in 2024 and up 56.39% in 2023, after being down 28.91% in 2022), as the sector declined 4.36% for the month but remained up 223.67% YTD (67.80% from the 2023 close). Even as selling overpowered buying, there was still enough buying to support the market and limit the overall impact. At this point, optimism seems to be prevailing over what some see as a short-term pullback, even if the Santa Claus rally does not materialize (the S&P 500 YTD total return was 17.81% YTD). Adding to the optimistic view are enterprise technology spending (with AI leading the way) and consumers, with corporate tax credits and write-offs, as well as increased individual tax refunds (starting in February 2026) that are expected to stimulate the economy.
For November 2025, the S&P 500 posted a modest gain after being down most of the month (its last monthly decline was in April 2025, at -0.76%, with March 2025 being -5.75%), its seventh monthly gain, up 0.13% (22.98% cumulatively over the seven months), with 8 of the 11 sectors up (6 in October, 7 in September and 9 in August). Breadth improved and turned strongly positive, with 324 issues gaining and 177 declining (204 and 298 in October, and 248 and 255 in September). Health Care did the best, as it became the market leader, adding 9.14% for the month, up 14.26% YTD and up 15.27% from the 2023 close. Information Technology did the worst, as profit-taking saw increased selling, falling 4.36% for the month (its worst month since March 2025’s -8.87%), as it was up 23.67% YTD and up 67.80% from the 2023 close. Year-to-date, the S&P 500 was up 16.47% (17.81% with dividends), with all 11 sectors up, as 297 issues gained and 203 were down; Communication Services led the sectors, up 33.83% YTD, and Real Estate did the worst, up 2.51%.
For December 2025, the initial attention will be on the Dec. 9-10 FOMC meeting, as the Street expects (86%, per CME FedWatch) an announcement of its third consecutive interest rate cut of 0.25% (bringing the rate to 3.50%-3.75%). After that, economic reports, both those that were postponed during the 43-day government shutdown (some were canceled) and those that are current, will dominate the news (the monthly jobs report comes out Tuesday, Dec. 16). Economists will evaluate their projections, with traders evaluating (and adjusting) their portfolios; higher market volatility is expected during this period, as directions may change for groups of stocks. In the background for trades (but prevalent in the news) will be the short-term continuing resolution bill, which ended the government shutdown and will expire on Jan. 30, 2026, with the main issue still being the 2025 year-end expiration of the subsidies to individuals (estimated to be 24 million people) for the Affordable Care Act’s premiums. The Street expects an extension of the subsidies along with a partial scheduled phase-out of benefits for some individuals based on income.
