“There’s little that’s as dangerous for investor health as insistence on extrapolating today’s events into the future” – Howard Marks
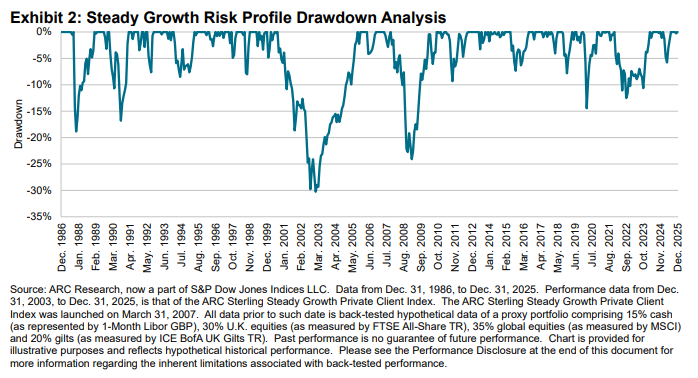
Despite a pivot in 2022, investors have been enjoying reasonably benign market conditions over the past 17 years. Financial markets have delivered strong performance since the 2008 Global Financial Crisis (GFC) as evidenced by the 7.1% annualized increase in the ARC Sterling Steady Growth Private Client Index (ARC Sterling Steady Growth PCI) since the March 3, 2009, low. The performance over this period compares favorably to the 5.9% annualized performance demonstrated by the index since its inception on Dec. 31, 2003.
Exhibit 1 shows the drawdown history of the ARC Sterling Steady Growth PCI since inception. The drawdown related to the GFC was a difficult experience for those invested at that time. Since then, drawdowns have been relatively shallow and short-lived.
For the past 17 years, investors have become used to higher-than-average performance and lower-than-average risk as measured by drawdown. The past three years have been even more investor-friendly, with steady growth investors enjoying an annualized return of 8.3% over this period with only the briefest of wobbles in Q2 2025. Anomalous periods such as this can lead to what behavioral scientists call “recency bias.” Recency bias is a cognitive bias in which people place too much weight on recent events (positive or negative) and underestimate long‑term trends or historical probabilities.
Supporting the view that positive recency bias might be at play, it is becoming increasingly rare to find vocal opponents of the perceived wisdom that “markets always go up in the long run” or “time in the market beats timing the market.” These bold statements may be true, but to really understand the risks related to any investment it is advisable to back-test using as much historical data as is available. In this way, it is possible to put “recent” performance into context.
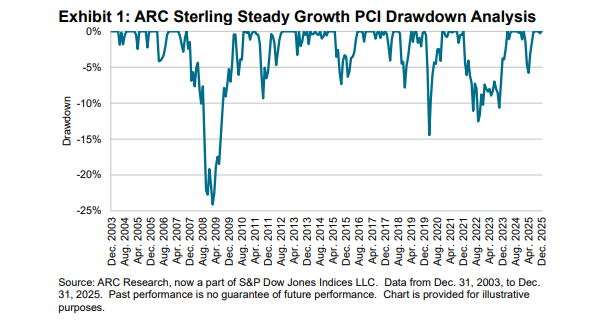
The ARC Private Client Indices (PCI) are constructed using the real performance (net of fees) of over 350,000 discretionary managed portfolios. This makes the PCI a critical reference point for investors wishing to make informed decisions about their investment strategies. The one limitation of using the PCI for this purpose is that the data is only available from the start of 2004. To provide a more thorough historical perspective we have chain-linked the performance of a representative proxy portfolio (15% cash, 30% U.K. equities, 35% global equities and 20% gilts) to the actual PCI data. In this way, we have extended the period under review to 39 years, thereby incorporating several economic cycles. The results are shown in Exhibit 2.