












































Daily Index Insights offers a concise two-minute read on the latest news and trends in index markets. This resource includes performance data from S&P Dow Jones Indices across equities, fixed income, multi-asset, commodities, and factors. Our daily insights are designed to provide you with a comprehensive understanding of market movements, empowering you to make informed decisions based on the most current indices data and analysis.
“An apple a day, if well aimed, keeps the doctor away.”
P.G. Wodehouse (15 October 1881 – 14 February 1975)
On this day 211 years ago, Napoleon Bonaparte arrived at the isolated South Atlantic island of Saint Helena to begin his exile following his final defeat at Waterloo. The former French Emperor found himself marooned over 1,200 miles away from the nearest mainland. Determined to prevent him from escaping like he had from Elba, the British took no chances with their prisoner. They stationed hundreds of troops and kept multiple naval warships circling around the clock. Here is your daily dashboard.
-
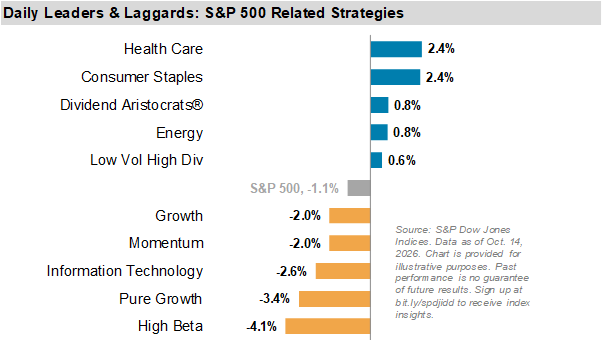
The S&P 500® declined 1.1% yesterday. Health Care (+2.4%), Consumer Staples (+2.4%), Dividend Aristocrats (+0.8%), and Energy (+0.8%) were among the strongest-performing large-cap exposures. High Beta (-4.1%) was the largest laggard, followed by Pure Growth (-3.4%), Information Technology (-2.6%), Momentum (-2.0%), and Growth (-2.0%).
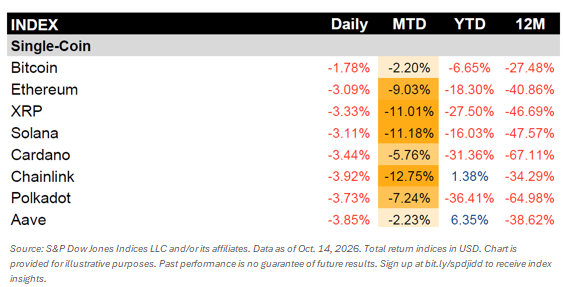
- It has been a difficult month so far for digital assets. A quick look at page 9 of the dashboard shows red almost everywhere: all single-coin indices are in negative territory month to date. Chainlink (-12.7%) has declined the most, while Bitcoin (-2.2%) has held up relatively better, with the smallest MTD loss among the single-coin indices.
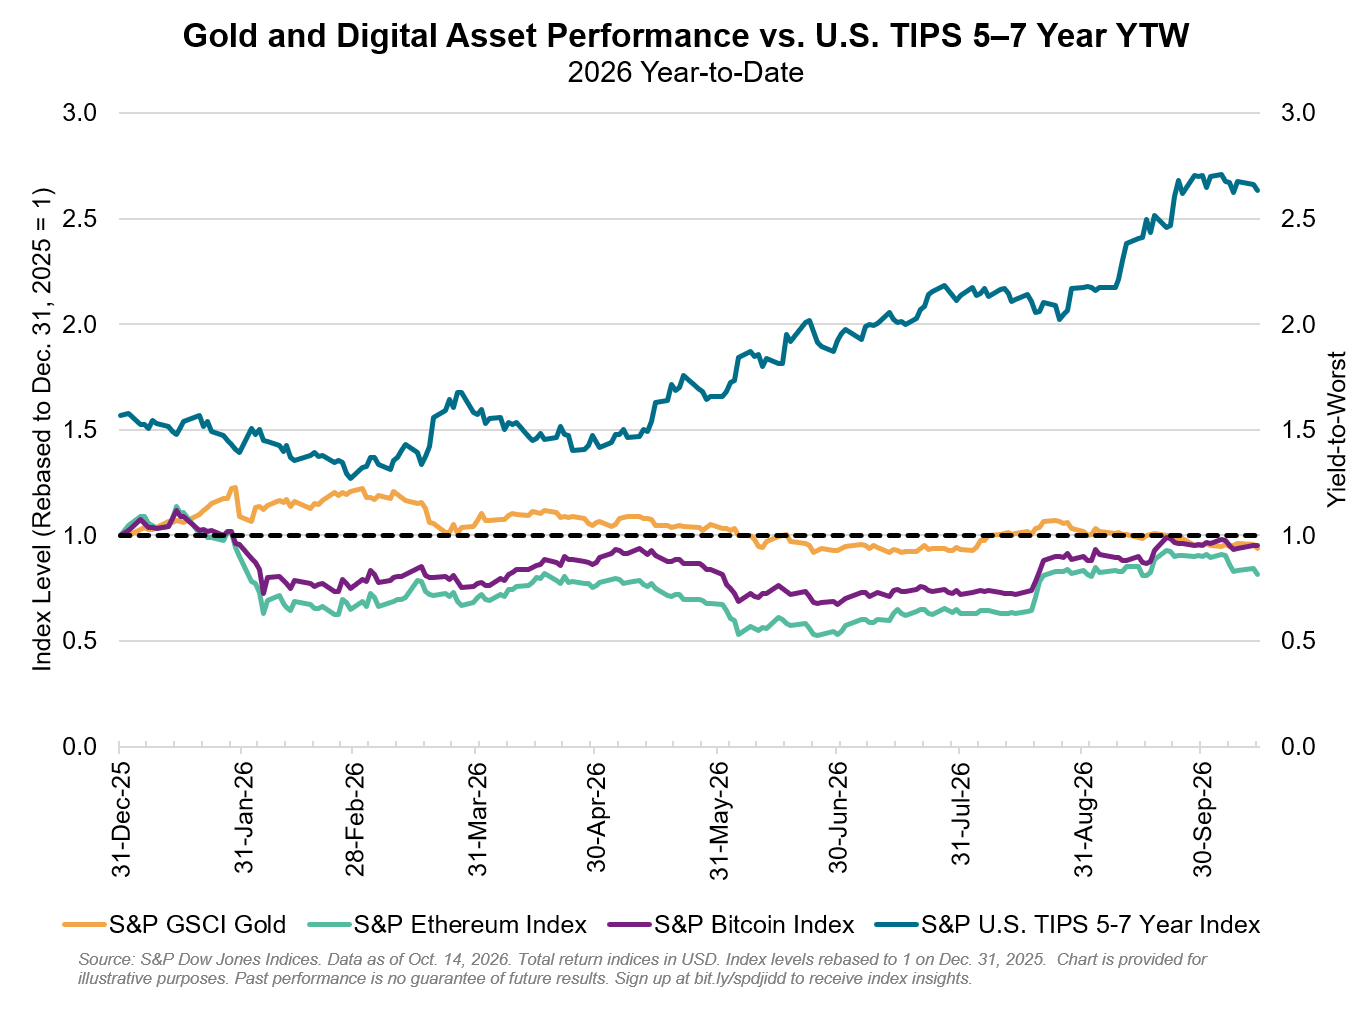
- Meanwhile, September’s inflation numbers are in, showing consumer prices up 3.7% year over year. Against this broader context, Bitcoin and Ethereum remain above their May lows despite a weak month for digital assets. For comparison, gold has trended lower since the start of the year, while the yield to worst on 5–7-year U.S. TIPS has moved sharply higher, but has started to slowly drop in the last month.
- High Beta, Pure Growth, and Momentum are the only three U.S. equity factor indices in negative territory month to date. By contrast, Low Volatility leads the factor space with a 4.0% gain, while the S&P 500 is up 0.9%. A sector lens helps explain this divergence. Information Technology is the only S&P 500 sector in negative territory this month, and its weakness has weighed disproportionately on High Beta, Pure Growth, and Momentum strategies.

