












































Daily Index Insights offers a concise two-minute read on the latest news and trends in index markets. This resource includes performance data from S&P Dow Jones Indices across equities, fixed income, multi-asset, commodities, and factors. Our daily insights are designed to provide you with a comprehensive understanding of market movements, empowering you to make informed decisions based on the most current indices data and analysis.
"Experience is simply the name we give our mistakes."
Oscar Wilde (16 October 1854 – 30 November 1900)
Happy 103rd birthday to The Walt Disney Company. On October 16, 1923, Walt and Roy Disney founded the Disney Brothers Cartoon Studio in Los Angeles. Operating from the back of a small real estate office, the brothers secured a contract to produce the Alice Comedies, a series of short films blending live action and animation, marking the first step toward building one of the world’s largest entertainment companies. Here is your daily dashboard.
-
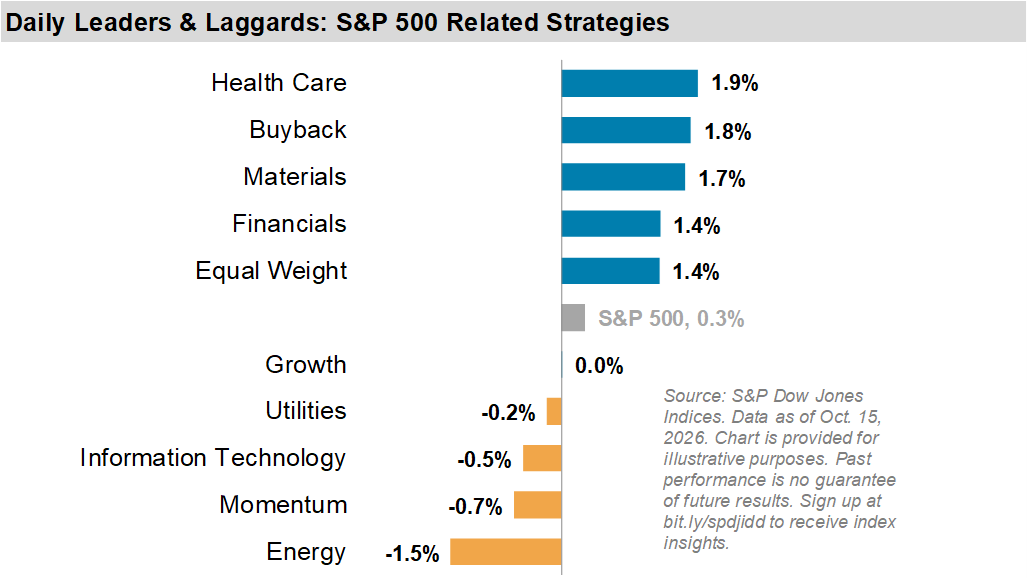
The S&P 500® rose 0.3% yesterday. Health Care (+1.9%), Buyback (+1.8%), Materials (+1.7%), and Financials (+1.4%) led the large-cap benchmark, while the S&P 500 Equal Weight (+1.4%) also outperformed. Energy (-1.5%), one of the strongest performers so far this week, was the biggest laggard, alongside Momentum (-0.7%), Information Technology (-0.5%), and Utilities (-0.2%).
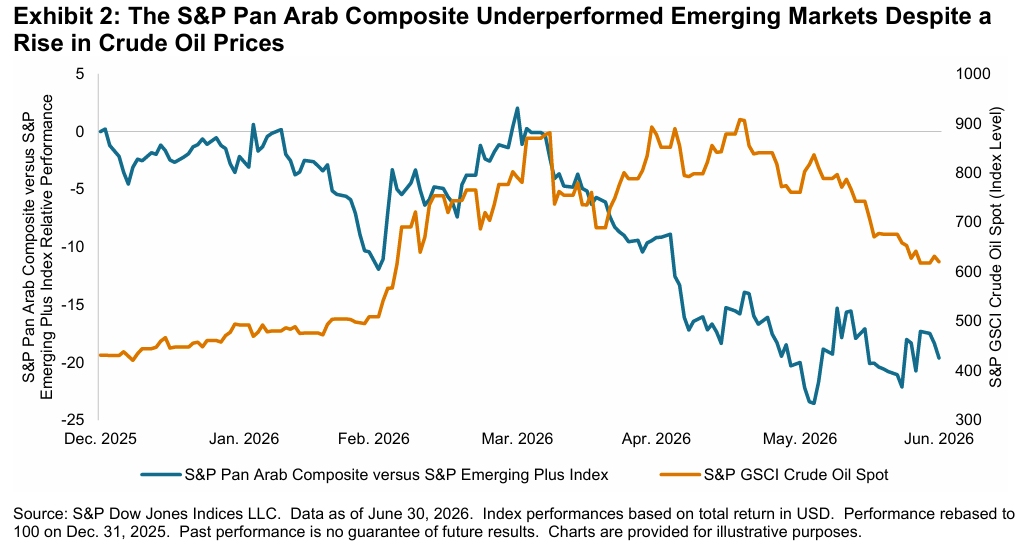
- The SPIVA® MENA Mid-Year 2026 results are in: 73% of MENA equity funds underperformed both the S&P Pan Arab Composite and the S&P Pan Arab Composite LargeMidCap in the first half of the year. Heightened geopolitical and energy-market volatility shaped the period, as early support from rising oil prices faded and investor attention shifted toward markets and companies benefiting from the global AI and semiconductor buildout. Despite a supportive commodity backdrop, MENA equities trailed broader emerging markets. Read more here.
- Wrapping up the week, here are a few recommended reads for your weekend:
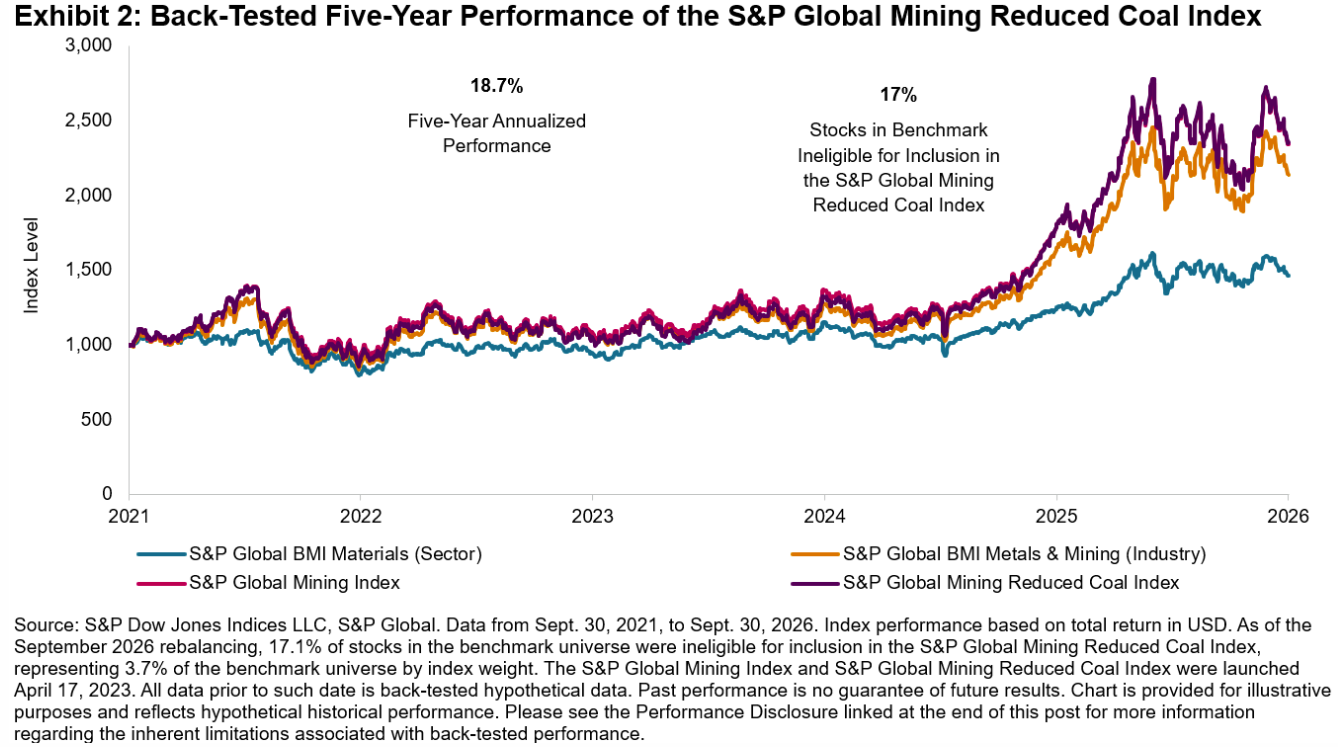
- Look Again, It’s Coal Outside: Vidushan Ragukaran looks at the S&P Global Mining Reduced Coal Index, which offers exposure to the metals and minerals behind electrification, energy security, and digital infrastructure, including copper, lithium, uranium, gold, and silver, while reducing coal involvement.
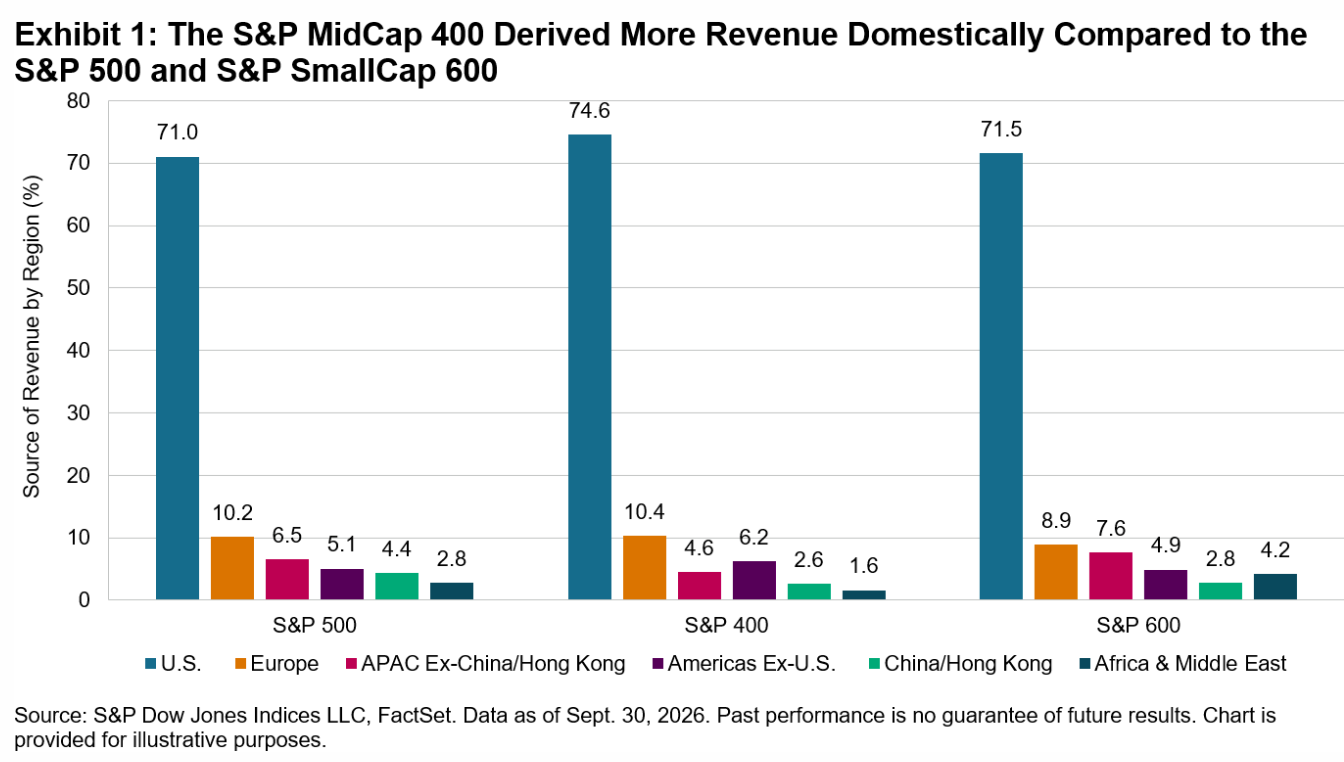
- Poll Position: Performance of the S&P MidCap 400 around Mid-Term Elections: With U.S. midterm elections in focus, Florence Chapman examines the S&P MidCap 400’s historical performance. Mid caps outperformed the S&P 500 in four of the past five post-election six-month periods, potentially reflecting higher domestic revenue exposure and unique sector mix.
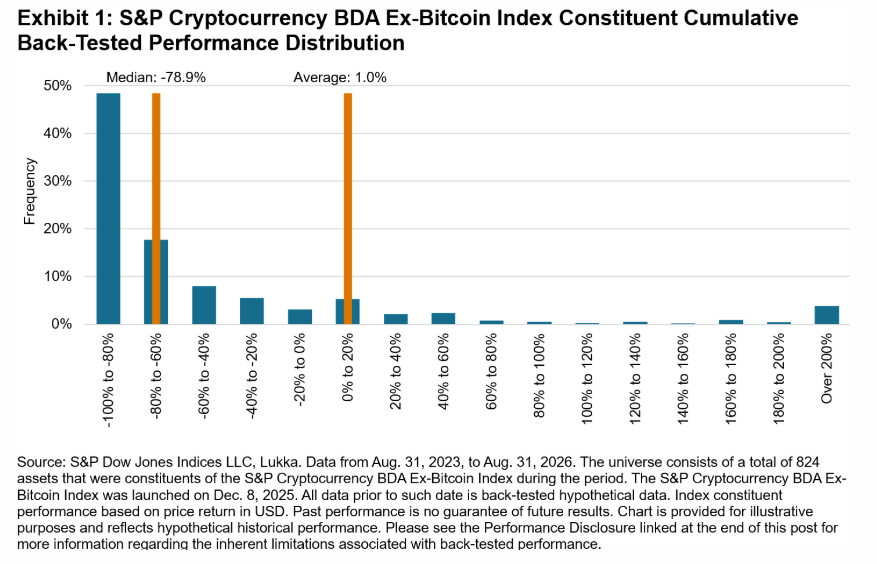
- The Case for Indexing Cryptocurrencies: Marco Zhang explores what happens when investors look beyond Bitcoin, showing how a diversified index approach can offer transparent exposure to a market where a small number of tokens have historically driven performance.
- Look Again, It’s Coal Outside: Vidushan Ragukaran looks at the S&P Global Mining Reduced Coal Index, which offers exposure to the metals and minerals behind electrification, energy security, and digital infrastructure, including copper, lithium, uranium, gold, and silver, while reducing coal involvement.
