










































Unequal Opportunities: SPIVA Europe U.K. Active Fund Performance in H1 2026
The first half of 2026 was an eventful one for markets. The AI buildout, war in the Middle East and rising government bond yields competed for attention globally. In the U.K., domestic political uncertainty added to the mix. This backdrop created opportunities for U.K. active funds, but their ability to make the most of them varied by category.
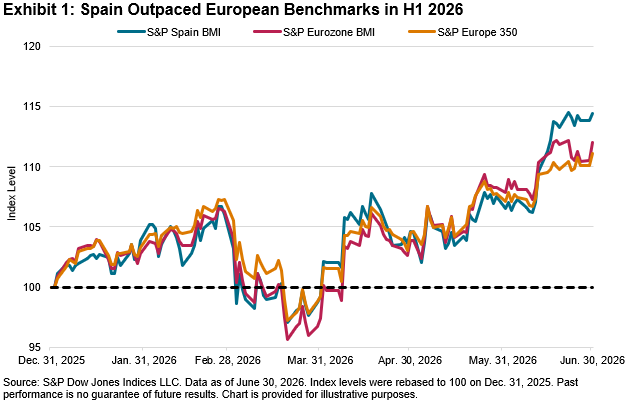
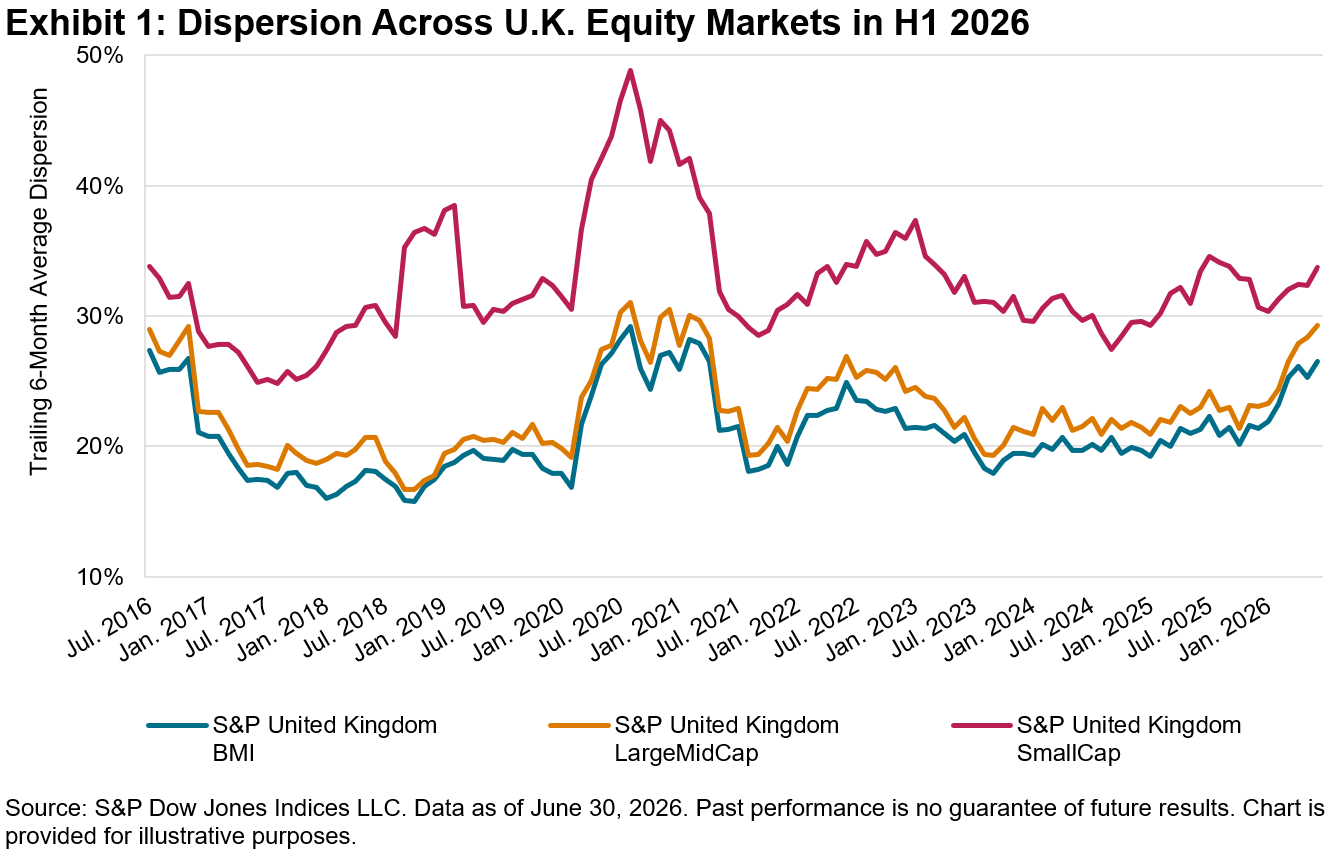
Equity market dispersion, which is the spread of constituent returns, provides one measure of market opportunity. Exhibit 1 shows that dispersion increased across the U.K. equity market in H1 2026, creating greater scope to add value.1
Source: S&P Dow Jones Indices LLC. Data as of June 30, 2026. Past performance is no guarantee of future results. Chart is provided for illustrative purposes.
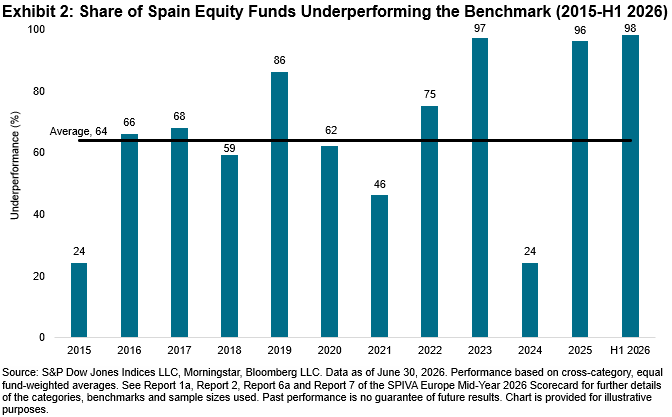
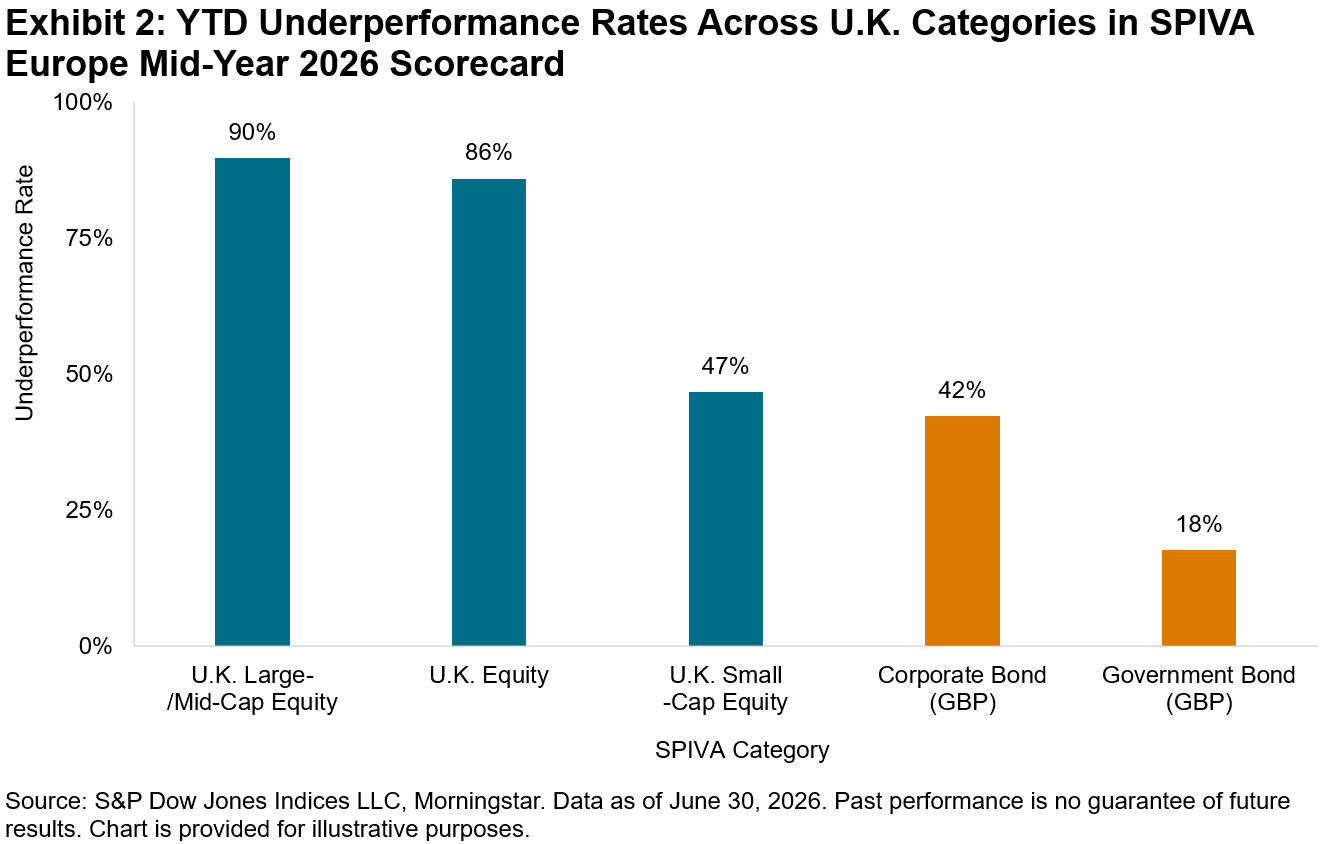
Despite greater scope to add value, results in the SPIVA Europe Mid-Year 2026 Scorecard varied widely across categories, as Exhibit 2 shows. While 90% of U.K. Large-/Mid-Cap Equity funds and 86% of U.K. Equity funds underperformed YTD, the rates were 47% for small-cap funds, 42% for GBP corporate bond funds and 18% for GBP government bond funds.
Source: S&P Dow Jones Indices LLC, Morningstar. Data as of June 30, 2026. Past performance is no guarantee of future results. Chart is provided for illustrative purposes.
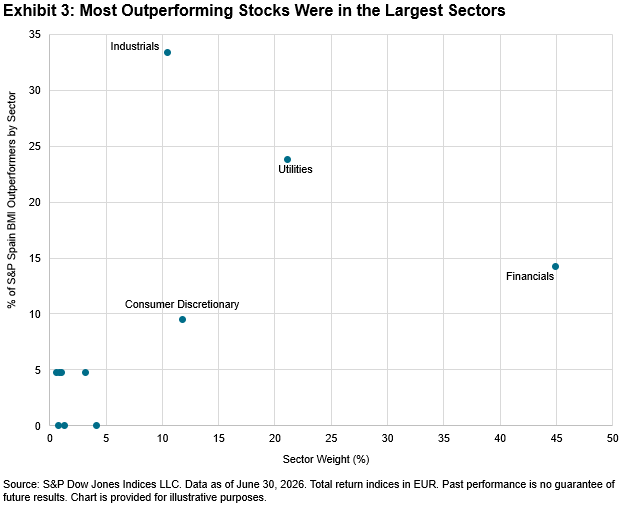
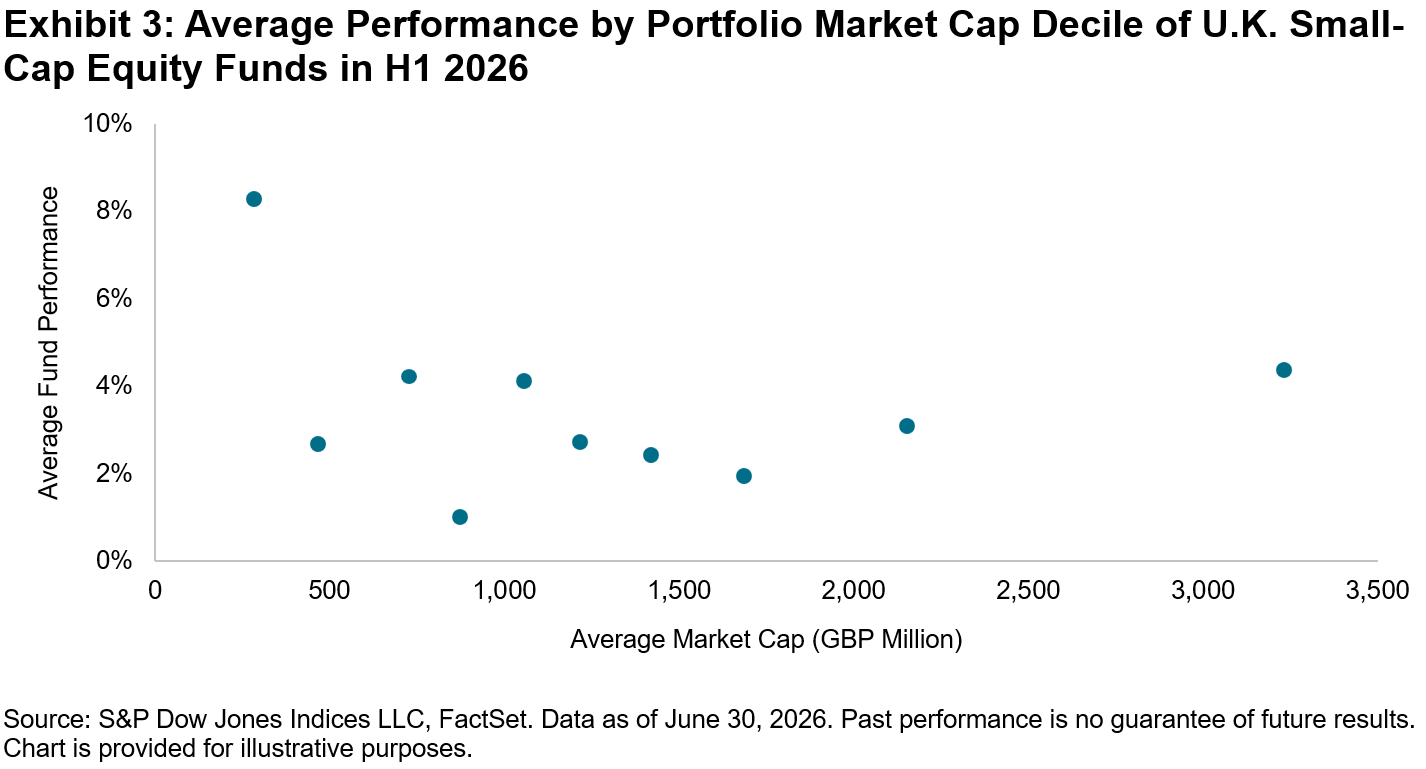
Rather than revisit the familiar challenges facing active funds, the focus turns to categories where most managers outperformed, starting with small-cap equities. Perhaps the most obvious explanation for their success is a systematic size bias. The S&P United Kingdom LargeMidCap gained 9% in H1 2026, compared with 3% for the S&P United Kingdom SmallCap. A bias to larger companies could therefore have helped performance. However, Exhibit 3 groups U.K. Small-Cap Equity funds by average portfolio market capitalization decile and shows no clear relationship between size and performance.
Source: S&P Dow Jones Indices LLC, FactSet. Data as of June 30, 2026. Past performance is no guarantee of future results. Chart is provided for illustrative purposes.
With size bias unlikely to explain small-cap managers’ success, dispersion offers another possible explanation. U.K. small-cap dispersion exceeded large- and mid-cap dispersion in H1 2026. However, this has been true for the past decade, while manager outperformance has been inconsistent.2
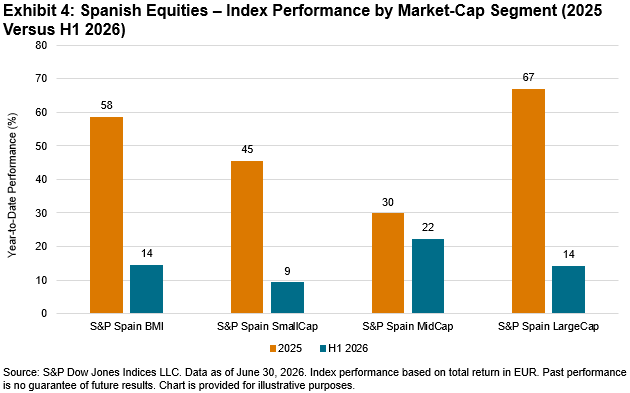
The difference may therefore lie not in the level of dispersion, but in its source. Exhibit 4 shows that sector contributions to small-cap dispersion rose sharply to their highest level since the series began in December 2006. This may have created greater opportunities for funds positioned in the right sectors than in recent years.
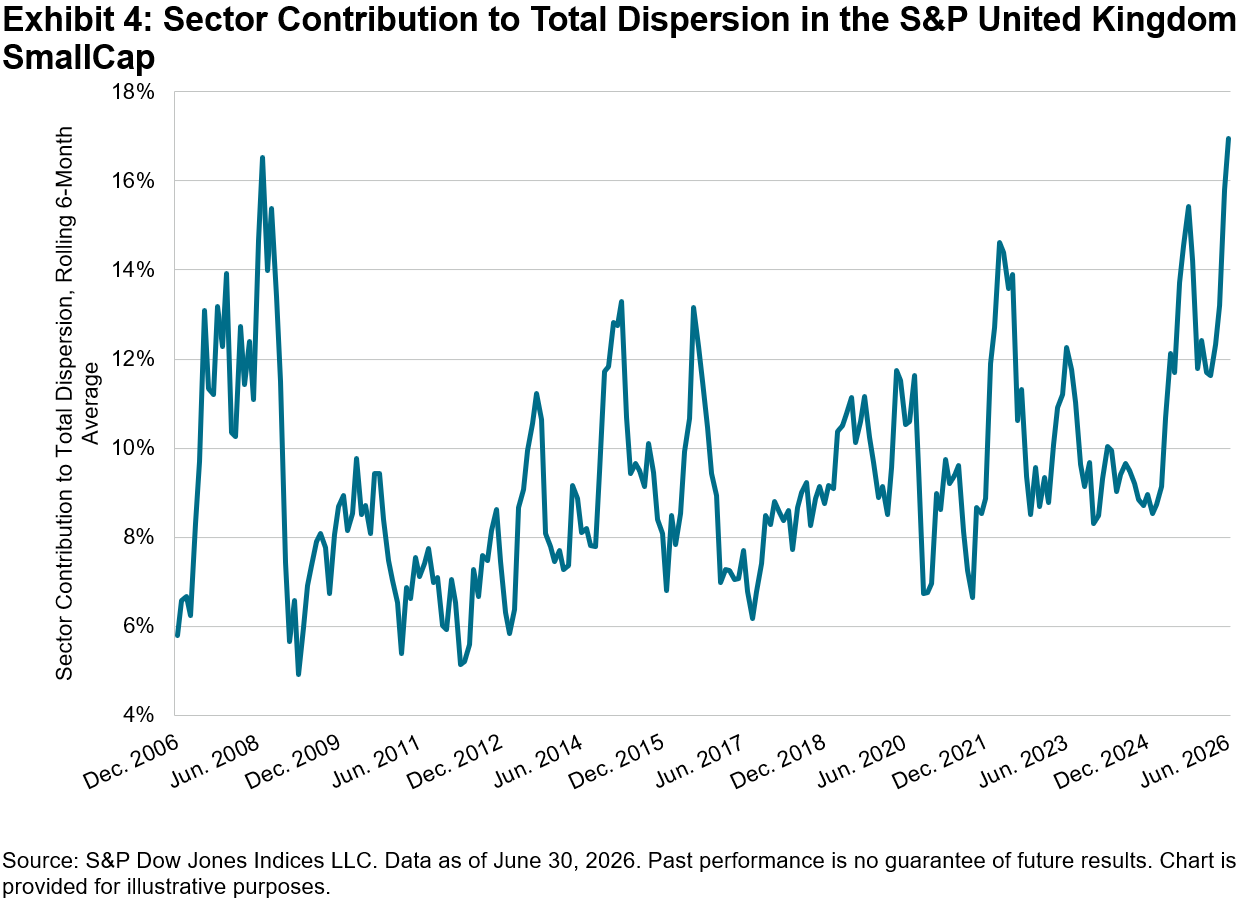
Source: S&P Dow Jones Indices LLC. Data as of June 30, 2026. Past performance is no guarantee of future results. Chart is provided for illustrative purposes.
Beyond equities, fixed income was also fertile ground for active managers, with return skewness a possible factor. In equities, a small number of stocks can account for an outsized portion of index performance.3 Fixed income often shows the opposite pattern, with a few poor performers dragging down the index while the median constituent outperforms.
This was evident across GBP fixed income in H1 2026. Exhibit 5 shows that over 50% of constituents in both corporate and government bond indices outperformed their respective indices. Avoiding the largest detractors therefore may have offered active funds a route to outperformance.
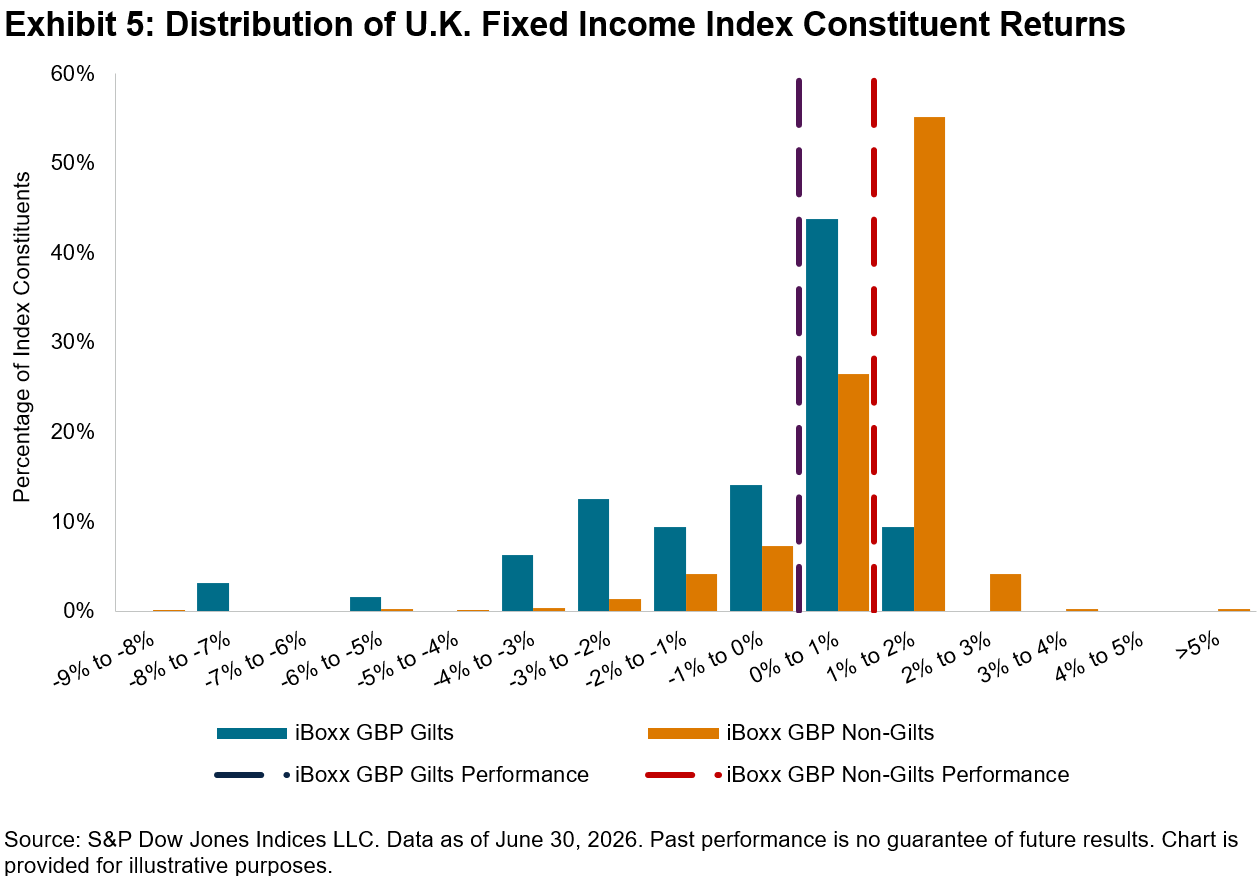
Source: S&P Dow Jones Indices LLC. Data as of June 30, 2026. Past performance is no guarantee of future results. Chart is provided for illustrative purposes.
In the first half of 2026, U.K. markets illustrated that opportunity does not guarantee active fund outperformance. Success also depends on the form that opportunity takes and funds’ ability to take advantage of it, highlighting the value of looking beyond headline performance numbers.
1 Edwards, Tim, and Craig J. Lazzara. “Dispersion: Measuring Market Opportunity” S&P Dow Jones Indices. December 2013.
2 Smith, Euan. “One to Forget: SPIVA Europe U.K. Equity Active Fund Performance in 2025” S&P Dow Jones Indices. April 7, 2026.
3 Ganti, Anu. “Skewing Success” S&P Dow Jones Indices. Sept. 30, 2025.
This content may be AI-assisted and is composed, reviewed, edited, and approved by S&P Global.
The posts on this blog are opinions, not advice. Please read our Disclaimers.