










































During tumultuous equity market environments like the present, characterized by heightened AI-related anxiety, asset owners have often turned to fixed income in search of protection. This year, however, bonds have offered little refuge. Treasury yields have risen and continue to fluctuate as markets reassess inflation and the path of Fed policy. Most recently, a hotter-than-expected October CPI print pushed yields across the curve back toward or above 5%, while a roughly in-line PPI reading later in the week put further pressure on the long end. Together, these shifts have created a challenging backdrop for both stocks and bonds.
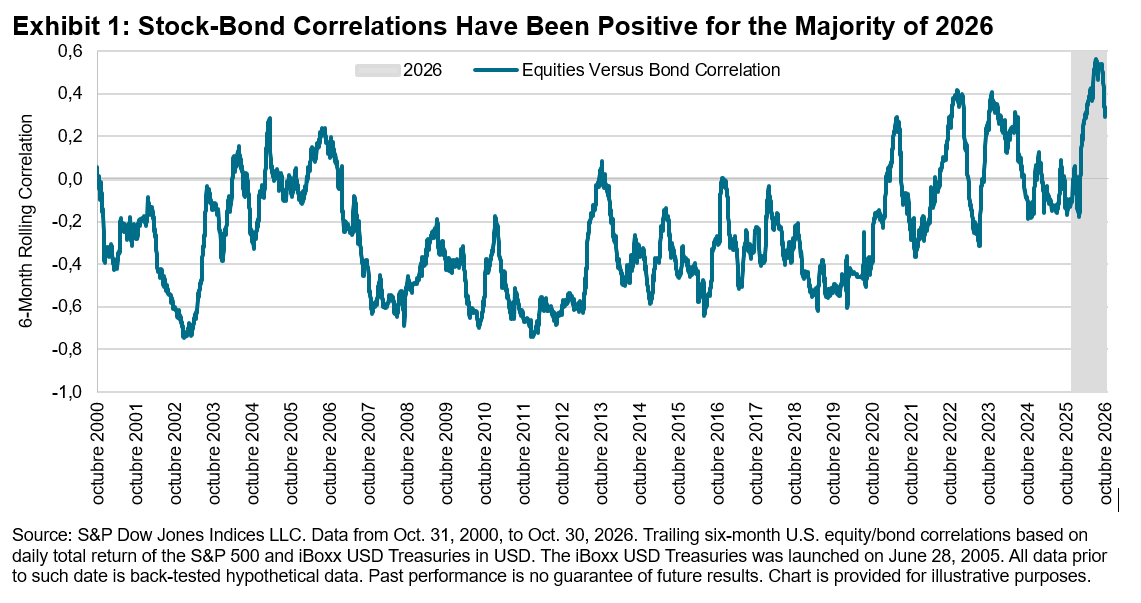
The traditional 60/40 portfolio,1 which allocates 60% to equities and 40% to fixed income, has long relied on bonds2 to help offset equity market losses. More recently, persistent inflation, fiscal deficit concerns and the reliance of mega-cap hyperscalers on the debt markets for financing may have contributed to stocks and bonds becoming increasingly sensitive to similar risks. The diversification benefits that supported the 60/40 framework for decades have appeared to weaken, with six-month rolling stock-bond correlations remaining positive for much of 2026, as shown in Exhibit 1. More recently, however, that relationship may have begun to shift, with the S&P 500® falling 1% in October while the iBoxx USD Treasuries gained more than 2%.
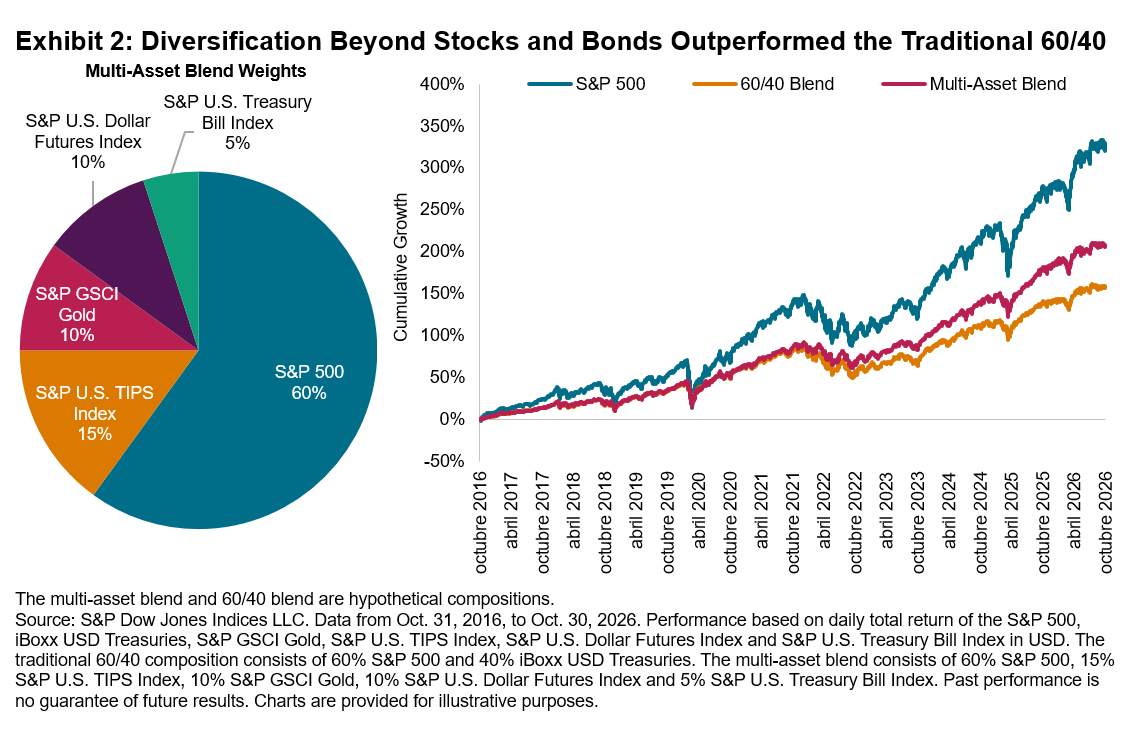
Given these headwinds, asset owners have historically looked beyond stocks and bonds for additional sources of diversification. For perspective, we can compare a traditional 60/40 stock-bond blend with a theoretical multi-asset blend. The multi-asset blend retained a 60% weight to equities and spread the remaining 40% among Treasury Inflation-Protected Securities (TIPS), gold, U.S. dollar futures and Treasury bills, asset classes influenced by different inflation, interest rate and liquidity dynamics.
Exhibit 2 compares the historical performance of the multi-asset blend with the S&P 500 and a traditional 60/40 stock-bond blend over the past 10 years. While the S&P 500 posted the highest absolute performance, the multi-asset blend outperformed the traditional 60/40 blend.
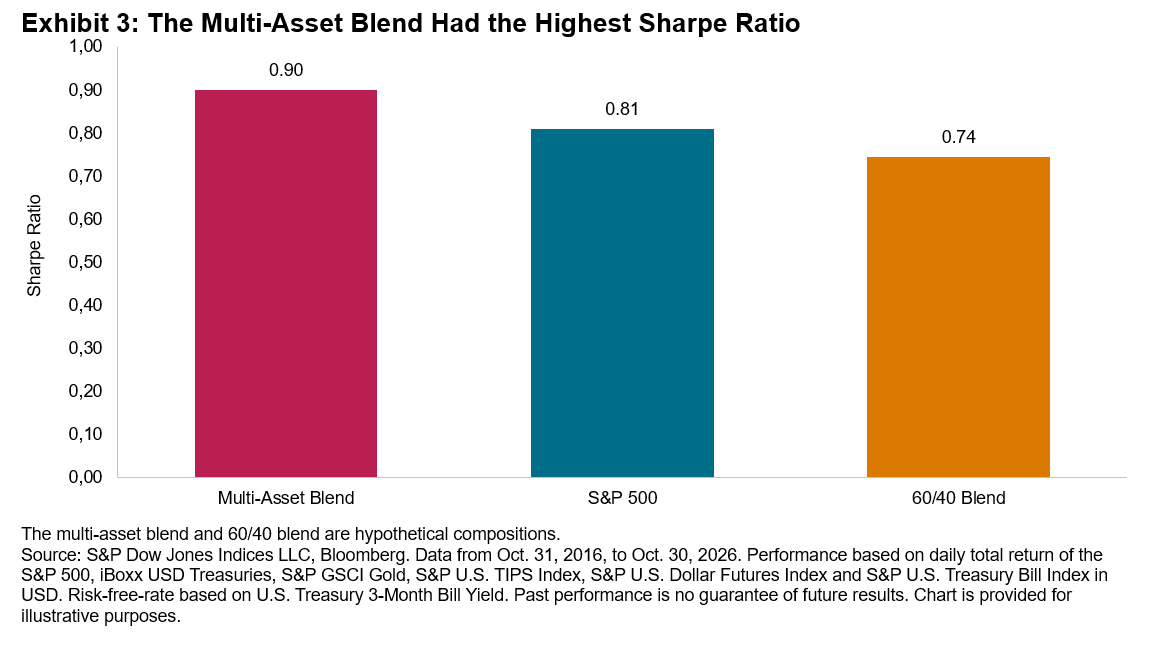
Performance, however, tells only part of the story. Asset classes like equities have historically coincided with greater volatility. Over the same period, annualized volatility was 18% for the S&P 500 and 11% for both the traditional 60/40 blend and the multi-asset blend. Exhibit 3 shows that the multi-asset blend had the highest risk-adjusted performance among the three approaches.
Fluctuations in Treasury yields and an evolving macro landscape have challenged traditional approaches to diversification. While the recent decline in stock-bond correlations may offer some relief, its durability remains uncertain. Indices could help identify and measure evolving sources of diversification across asset classes. As market regimes change, so may the assets that help manage risk.
1 Hakyung K. “Chart of the Week: Is the 60-40 portfolio dead?” Financial Times, Aug. 29, 2026.
2 Pham, Nga, Bei Cui and Ummul Ruthbah. “The Performance of the 60/40 Portfolio: A Historical Perspective.” CFA Institute, Research and Policy Center, Feb. 18, 2025.
The posts on this blog are opinions, not advice. Please read our Disclaimers.