










































Diversification Across the Cap Spectrum: Why The S&P Composite 1500 Matters
The S&P 500 fell 1% in October and dropped by 4% on Nov. 5, 2026, its worst day since April 2025, as AI-related worries weighed on tech stocks. Smaller caps have offered a refuge: in October, the S&P MidCap 400 and S&P SmallCap 600 outperformed the 500 by 3% and 4%, respectively.
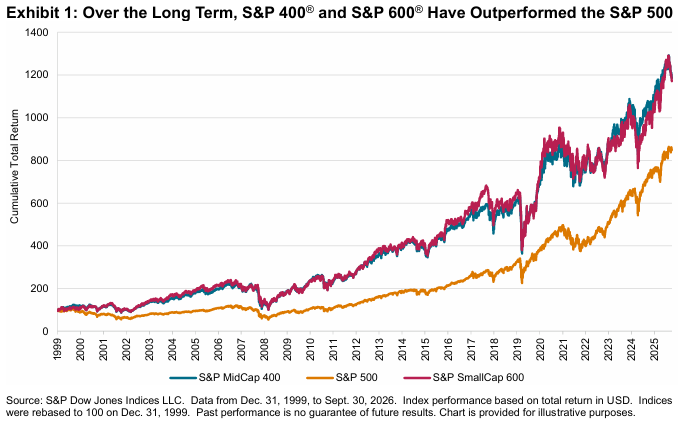
Mega-cap stocks have dominated headlines, but historically, smaller companies have had an outsized impact on market returns. In particular, the S&P MidCap 400 and the S&P SmallCap 600 outperformed the S&P 500 over the past quarter century.
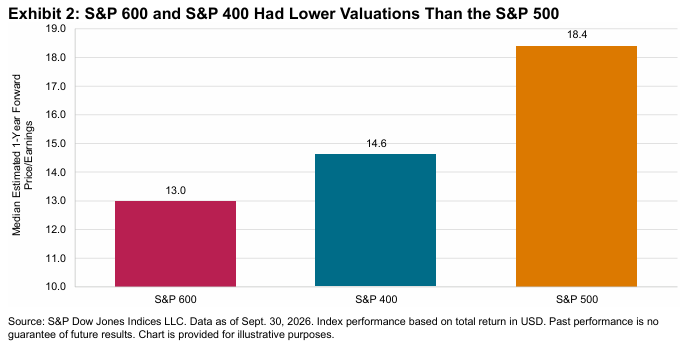
One mechanism that may help explain why small caps have tended to outperform larges caps is their value tilt, as small caps have typically traded at lower valuations than large caps. Exhibit 2 shows that, as of Sept. 30, 2026, the S&P 600 and S&P 400 traded at forward price-to-earnings (P/E) ratios of 13.0 and 14.6, respectively, compared to a forward P/E of 18.4 for the S&P 500.
By combining the S&P 500 with the S&P MidCap 400 and the S&P SmallCap 600, the S&P Composite 1500 encompasses larger and smaller stocks, offering a more comprehensive view of the domestic stock market. Notably, the S&P Composite 1500 covers more than 95% of the cumulative U.S. equity market capitalization, as proxied by the S&P Total Market Index.
This inclusion of smaller companies has meant that the S&P 1500™ has outperformed the S&P 500 over the long term. However, the outperformance of the index as a whole does not necessarily extend to the performance of the component stocks in the index. For example, 70% of companies within the S&P 1500 underperformed the index in 2025.
The posts on this blog are opinions, not advice. Please read our Disclaimers.