






































IN THIS LIST

Beyond the Bullion: Market Trends in Global Gold Production

Quarterly Changes May Not Be Constant

Tech Titans and Global Champions: A Look Inside the S&P Global 100

S&P ADR Indices: Focusing on Foreign Equities

Rebalance Review of the S&P Global Clean Energy Transition Index - H1 2025

Beyond the Bullion: Market Trends in Global Gold Production

Contributor Image
Darius Nass

Associate Director, Global Equity Indices

S&P Dow Jones Indices

Gold Producers in a Shifting Macro Landscape

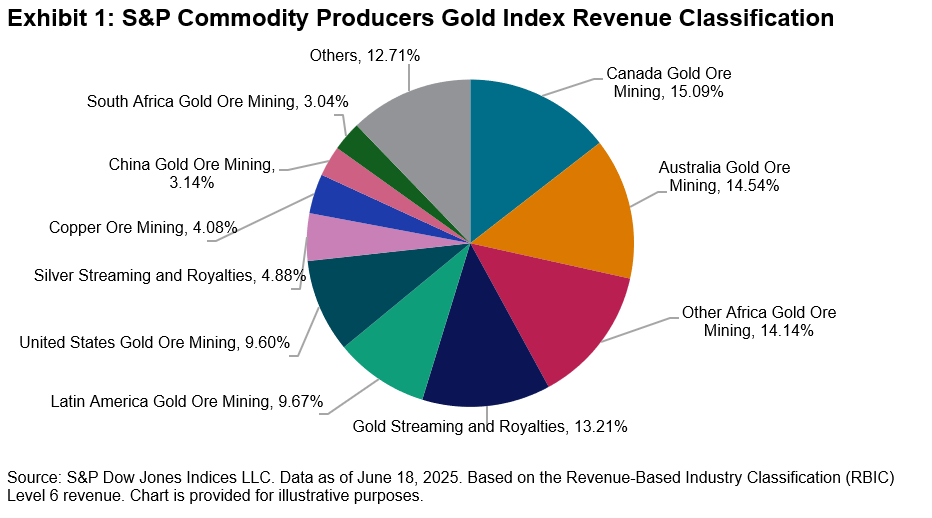
Gold's break above USD 3,000 per ounce in Q1 2025—a roughly 40% increase since year-end 2023—is a reflection of the revived interest in mining companies amid economic uncertainty and geopolitical risks.1 The S&P Commodity Producers Gold Index has responded with a 64% total return over the past 12 months,2 outpacing the spot price of gold (44%) and silver (23%) bullion and confirming mining companies' relatively higher sensitivity to metal prices. However, the lift has been uneven with high beta mid caps seeing the highest returns, while large caps delivered only modest gains.

Composition and Methodology Overview for the S&P Commodity Producers Gold Index

The S&P Commodity Producers Gold Index serves as a snapshot of the listed gold universe, and as of June 18, 2025, drew 59 of the largest, most liquid producers and royalty firms from the S&P Global BMI. To be included, constituents must trade on developed market exchanges, have a float-adjusted market capitalization of at least USD 500 million (USD 250 million for current constituents) and a minimum three-month ADVT of USD 1 million (USD 500,000 for current constituents). The index is float-market-cap weighted with a single company cap of 10% and rebalanced every June and December.
Gold Producers Delivered Two Times Bullion's Return at Twice the Volatility

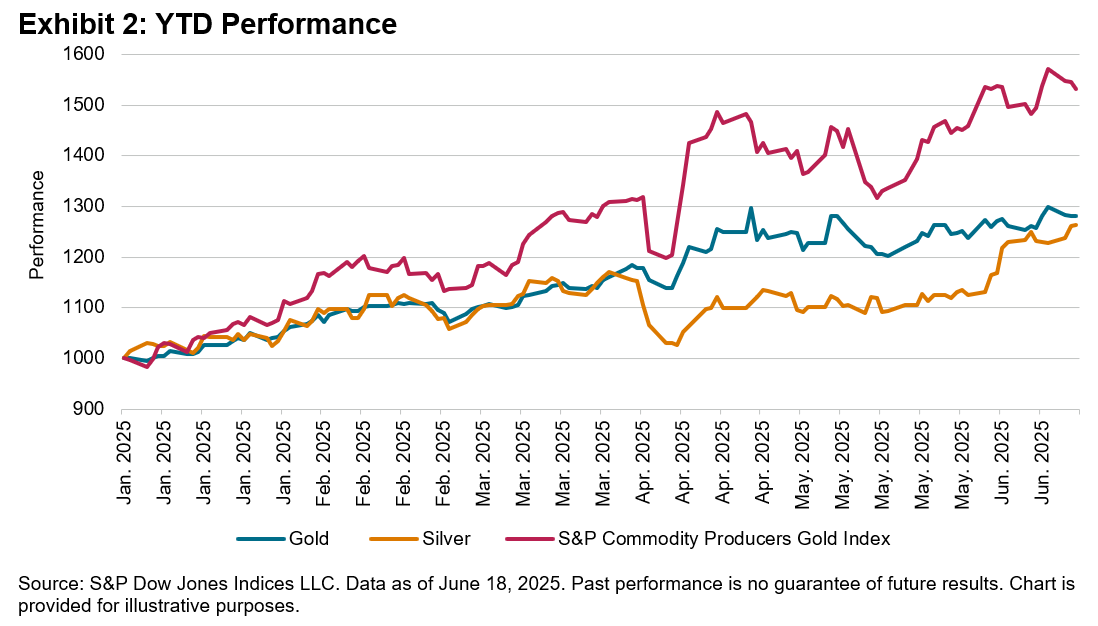
After a challenging 2021-2022 period, gold equities rebounded significantly. The S&P Commodity Producers Gold Index was up 53% YTD,3 nearly doubling gold's rise of 28%. Similarly, volatility has remained roughly double. A 10-15% pullback in early April—sparked by new U.S. tariffs, higher real yields, profit-taking and jurisdictional uncertainties—demonstrated gold producer equities' tendency to overshoot before recovering.
Small Caps Drove Return Dispersion as Large Caps Lagged

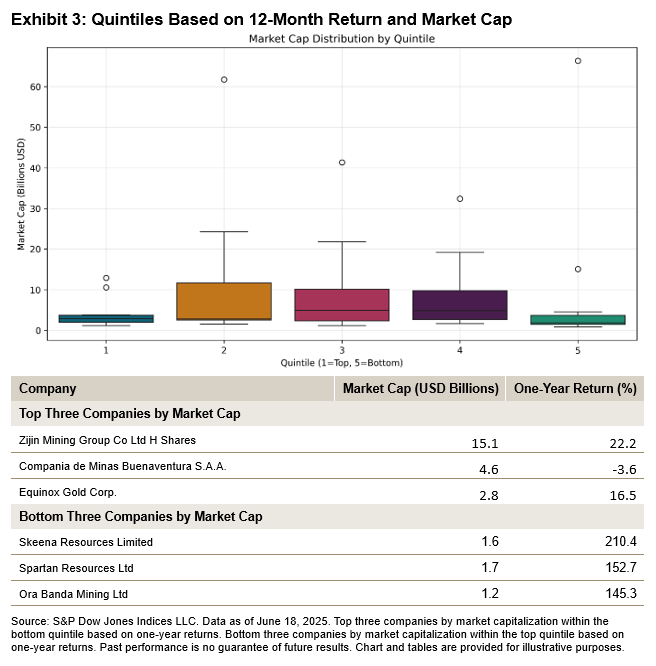
A closer look reveals significant return dispersion across index constituents. Over the past 12 months,4 the top-performing quintile of stocks (typically smaller operators) has more than doubled, while the bottom quintile, dominated by mega caps and royalty names, achieved only modest gains. Additionally, currency fluctuations and macro policy further contributed to the divergence. Producers with operational costs in ZAR or AUD enjoyed an added margin tailwind. Conversely, large, diversified miners could not match the positive momentum of mid-cap companies.5
Conclusion

Gold equities remain a leveraged, but often volatile, proxy for bullion, historically gaining roughly twice as much during upswings while suffering outsized losses during downturns. The sector has seen low-cost mining companies rewarded for leveraging FX advantages and disciplined capital allocation, with little regard for size. With free cash flow surging, dividends and buybacks have increased, and consolidation among mega caps is expected to continue. The S&P Commodity Producers Gold Index remains a key measurement of the gold equity story and highlights which trends are truly beyond the bullion in driving performance.


1 https://econofact.org/why-has-the-price-of-gold-risen-so-sharply

2 As of June 18, 2025

3 As of June 18, 2025

4 Ending June 18, 2025

5 https://www.globalxetfs.com.au/insights/post/gold-investors-its-time-to-let-go-of-gold-miners/

6 https://www.spglobal.com/market-intelligence/en/news-insights/research/mining-mna-in-2024-gold-dominates-mna-space-for-2nd-consecutive-year

7 https://www.blackrock.com/uk/literature/annual-report/blackrock-world-mining-trust-plc-annual-report.pdf


Quarterly Changes May Not Be Constant

Contributor Image
Hamish Preston

Head of U.S. Equities

S&P Dow Jones Indices

The S&P 500®, commonly referred to as The 500™, underwent its latest quarterly update—commonly known as rebalances—at the end of last week. S&P 500 rebalances take place after the close of the third Friday of the quarter-ending month and can involve constituent changes (additions and deletions) as well as updates to company characteristics, such as changes to the number of shares outstanding to reflect the latest publicly available data.

Recently, many market participants were surprised to see, or rather not to see, any S&P 500 constituent changes coinciding with the June 2025 rebalance. A cursory glance at recent history suggests there is some justification for these reactions: each quarterly update between June 2022 and March 2025 coincided with announced additions and deletions for the S&P 500.

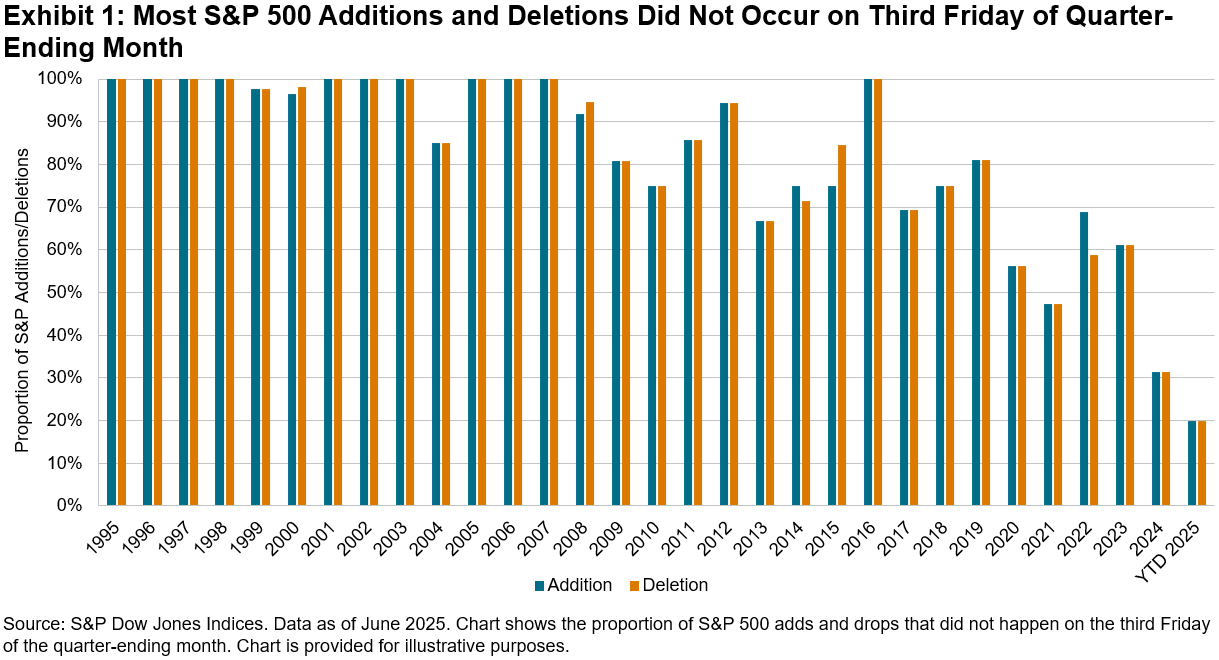
However, there is more than just historical precedent for a quarterly update without S&P 500 index additions and deletions—it has been a very common outcome! Around 90% of the nearly 800 S&P 500 constituent changes since 1995 did not take place on the third Friday of the quarter-ending month. Exhibit 1 shows that there were many years with zero constituent changes on these dates, demonstrating that S&P 500 rebalance turnover was typically driven by updates to company characteristics.

The timing of historical constituent changes reflects several important points. First, S&P 500 additions and deletions occur on an ongoing, as needed basis rather than on set reconstitution or rebalance dates. Second, around 70% of deletions since 1995 were caused by corporate events—such as mergers and acquisitions—that affected the index constituents' eligibility. The index committee responsible for maintaining the S&P 500 has no control over the timing of these events, but any resulting index deletion necessitates a corresponding addition to maintain the index's 500 company count.

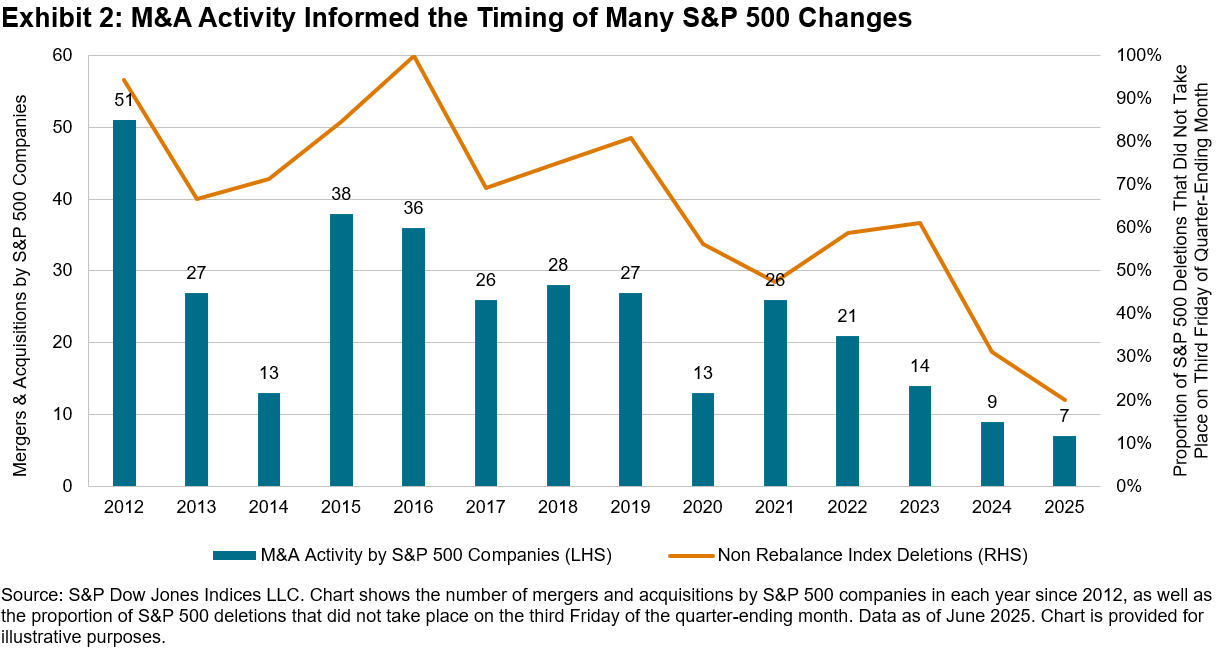
Exhibit 2 further illustrates these points by comparing: a) the number of mergers and acquisitions (M&A) by S&P 500 companies (blue bars), and b) the proportion of S&P 500 constituent changes that took place between quarterly updates (orange line) since 2012. Given that M&A activity drove many constituent changes, it is perhaps unsurprising that years with higher (lower) M&A activity typically saw a greater (lower) proportion of changes take place between standard quarterly updates.

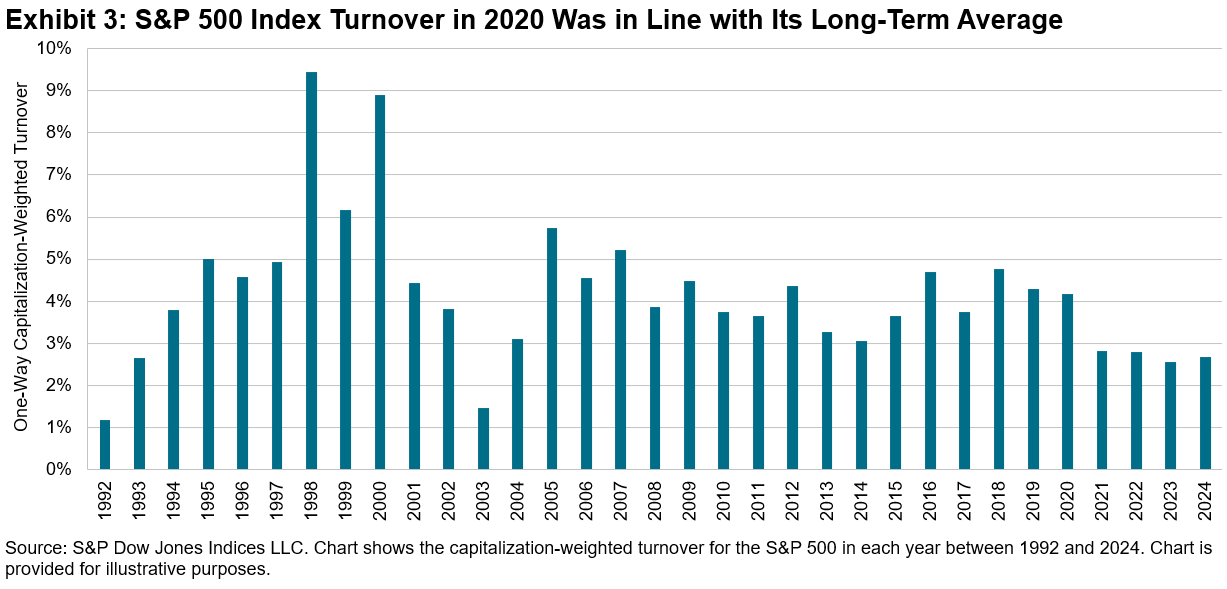
Additionally, it is important to recognize that index additions are not guaranteed when companies meet the eligibility criteria outlined in the S&P U.S. methodology document: the index committee is also mindful of sector balance and index turnover. Hence, existing constituents that may appear to violate one or more of the addition criteria are not automatically removed from the S&P 500, which helps to explain why we did not see elevated turnover in the S&P 500 in 2020. Indeed, Exhibit 3 shows that the one-way capitalization-weighted turnover for the S&P 500 in 2020 (4.17%) was in line with the long-term average since the early 1990s.

Although many market participants may have expected constituent changes at the June 2025 rebalance, relatively few constituent changes have taken place on the third Friday in March, June, September and December since 1995. This reflects the fact that the timing of many S&P 500 index changes was driven by corporate events, and that index changes are not guaranteed.


Tech Titans and Global Champions: A Look Inside the S&P Global 100

Contributor Image
Carlos Mendizabal

Senior Analyst, Global and Thematic Equity Indices Product Management

S&P Dow Jones Indices

The author would like to thank Darius Nass for his contributions to this blog.

Global Champions in a Cross-Current Macro Landscape

In early 2025, global equity markets were marked by heightened volatility due to AI-driven earnings growth, monetary policy normalization and rising trade uncertainty. Despite these challenges and mixed market signals, the S&P Global 100, consisting of diversified multinational companies, showed resilience and seems to have effectively navigated the market YTD.

Index Composition and Methodology

The S&P Global 100 is a subset of the S&P Global 1200 and consists of 100 of the world's leading publicly listed companies. Constituents are selected based on international revenue exposure, sector representation, liquidity and market capitalization. To qualify, companies must generate over 30% of their revenue and hold over 30% of their assets outside their home country, ensuring genuine global exposure. The index is weighted by float-adjusted market capitalization (FMC) and rebalanced quarterly in March, June, September and December.

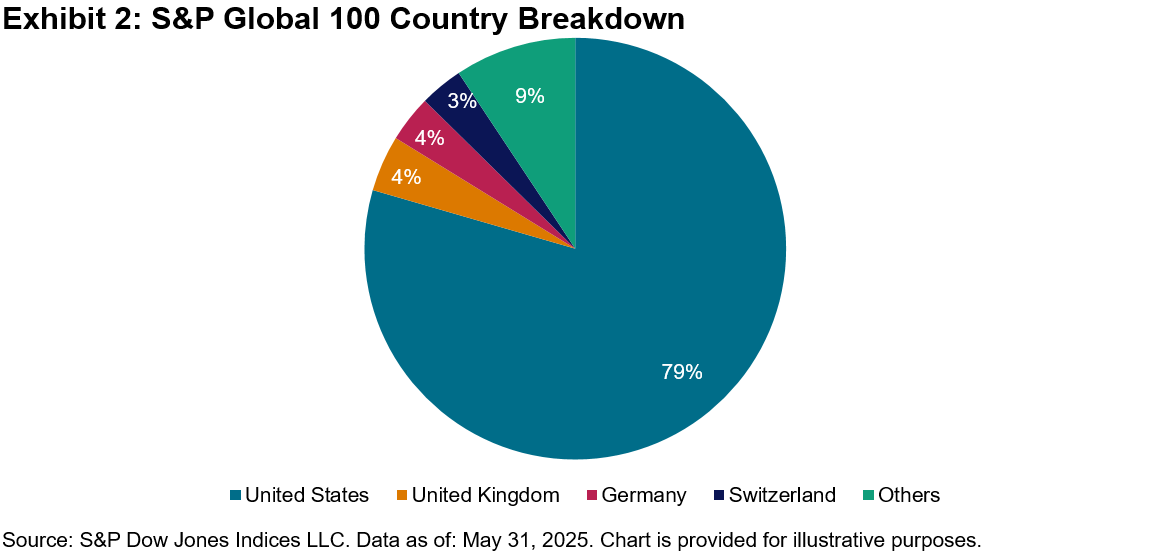
Although the index has significant weight in U.S.-domiciled companies as a byproduct of its methodology, its real economic exposure is more nuanced.

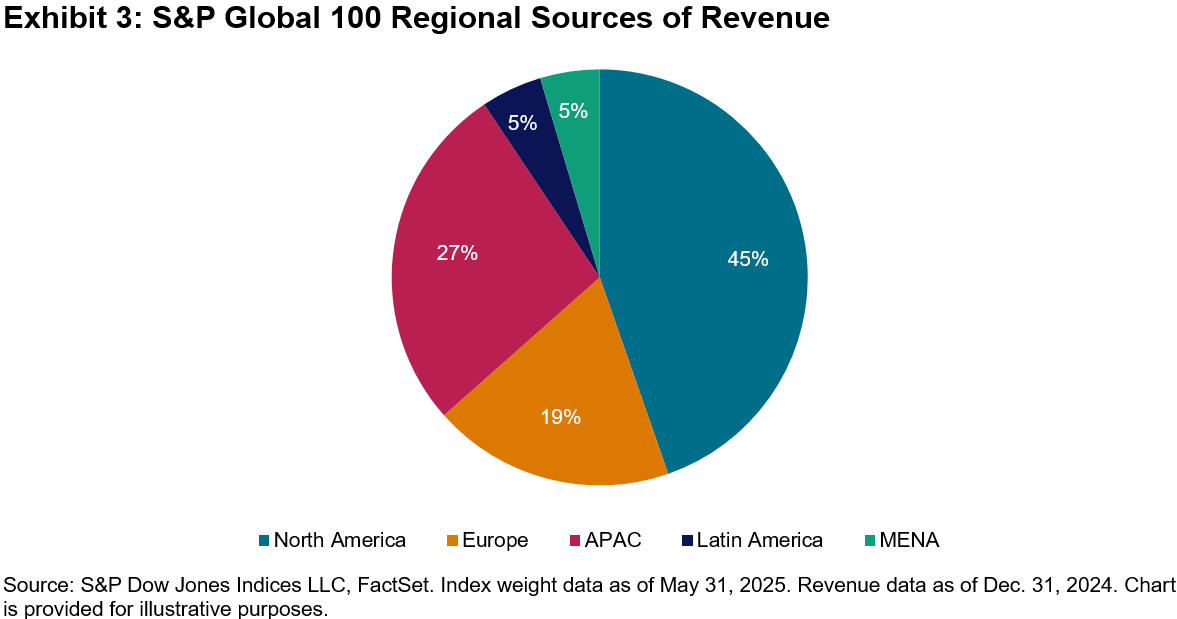
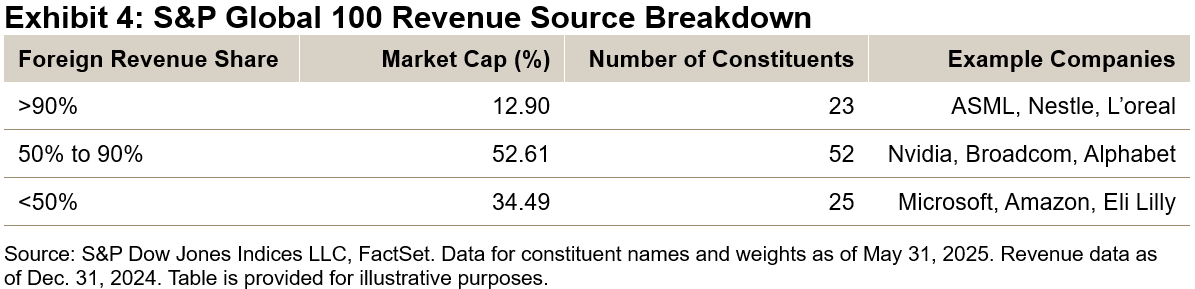
The FMC-weighted foreign revenue share of the index is approximately 60%, with a mean of 67% among all constituents. On average, index constituents generate more than half of their revenue outside their economic region.[1] Less than 15% of the index's FMC is near the 30% threshold, and none of these constituents overlap in terms of GICS® sector. As such, despite recent discussions on reshoring and global trade risks, significant turnover of the index appears unlikely.

Performance Review

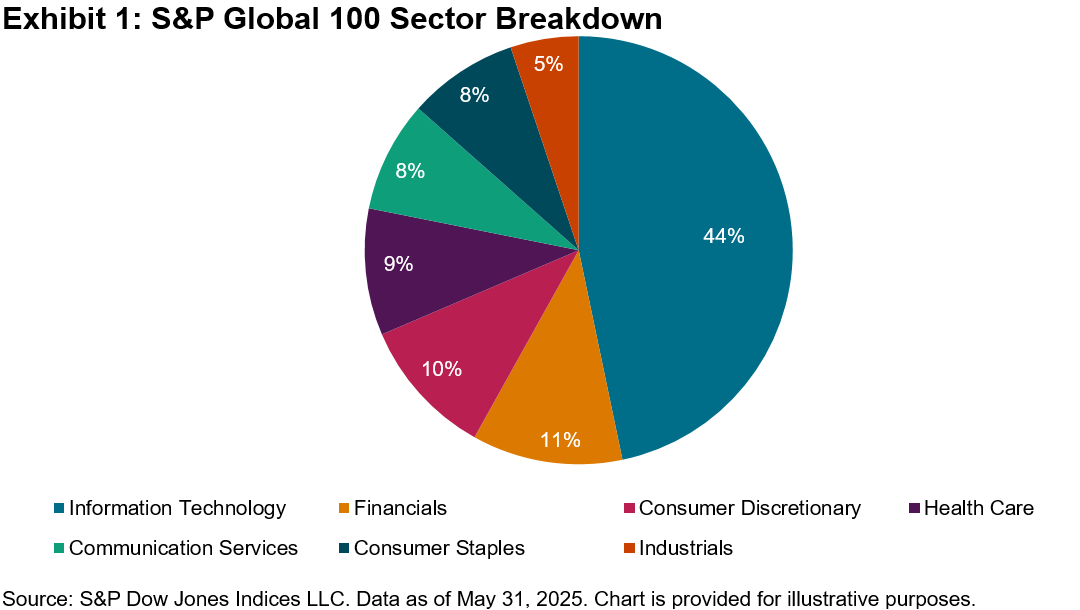
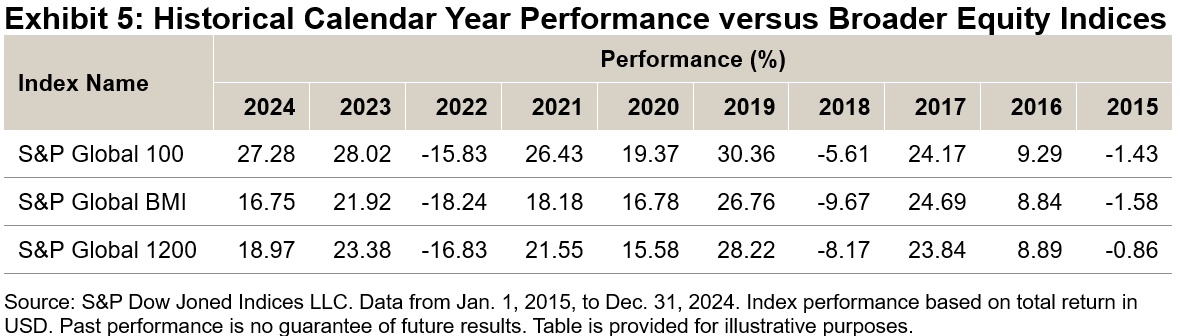
Following a robust 27.28% rally in 2024—driven by Big Tech earnings and multiple expansion—2025 has seen increased volatility due to changing rates expectations, high valuations and trade uncertainty. As of May 31, 2025, the S&P Global 100 posted a YTD gain of 2.30%, reflecting noticeable return differences across sectors and regions. Financials led with a contribution of 1.73% on the back of the elevated interest rate environment, while Consumer Staples and Industrials added 0.90% and 0.67%, respectively. Conversely, Information Technology, Consumer Discretionary and Communication Services lagged, with declines of 0.84%, 0.40% and 0.30%, respectively, as investors shifted from growth-oriented sectors. Regionally, U.S. equities contributed to a 0.80% decline in the index performance, while Europe more than offset that loss with a 2.55% impact due to favorable policies and attractive valuations. Asia-Pacific also contributed with a 0.54% gain, amid trade disruptions and tariff issues.[2]

Over the past decade, the index consistently outperformed broader global equity markets, demonstrating long-term resilience.

Concluding Insights

The S&P Global 100 continues to serve as a robust benchmark for tracking globally influential companies. Despite its focus on large float-adjusted market cap firms, the index's thoughtful design helps mitigate sector concentration and enhances revenue diversification. These characteristics make it particularly well-suited for navigating today's complex market environment, marked by macroeconomic uncertainty and shifting global dynamics.


[1] Source: S&P Dow Jones Indices LLC, FactSet. Data for constituent names and weights as of May 31, 2025. Revenue data as of Dec. 31, 2024.

[2] Source: S&P Dow Jones Indices LLC. Data as of May 31, 2025. Calculations are based on gross total return index levels in USD. Past performance is no guarantee of future results.


S&P ADR Indices: Focusing on Foreign Equities

Contributor Image
Diego Zurita

Senior Analyst, Global Equities & Thematics

S&P Dow Jones Indices

International equities have been gaining attention in 2025. As discussed in a previous blog post, international stocks have been outperforming U.S. stocks so far this year. The S&P ADR Index Series is one of the S&P Dow Jones Indices offerings that focuses on international markets through U.S.-listed securities.

American depositary receipts (ADRs) are securities that represent shares of non-U.S. companies that are held by a U.S. depositary bank and are listed on U.S. stock exchanges. They provide U.S. market participants access to foreign stocks, but incur fees different from those of their local listings. ADRs are suitable for direct indexing and could be of interest to those who don't have easy access to foreign stock markets.1

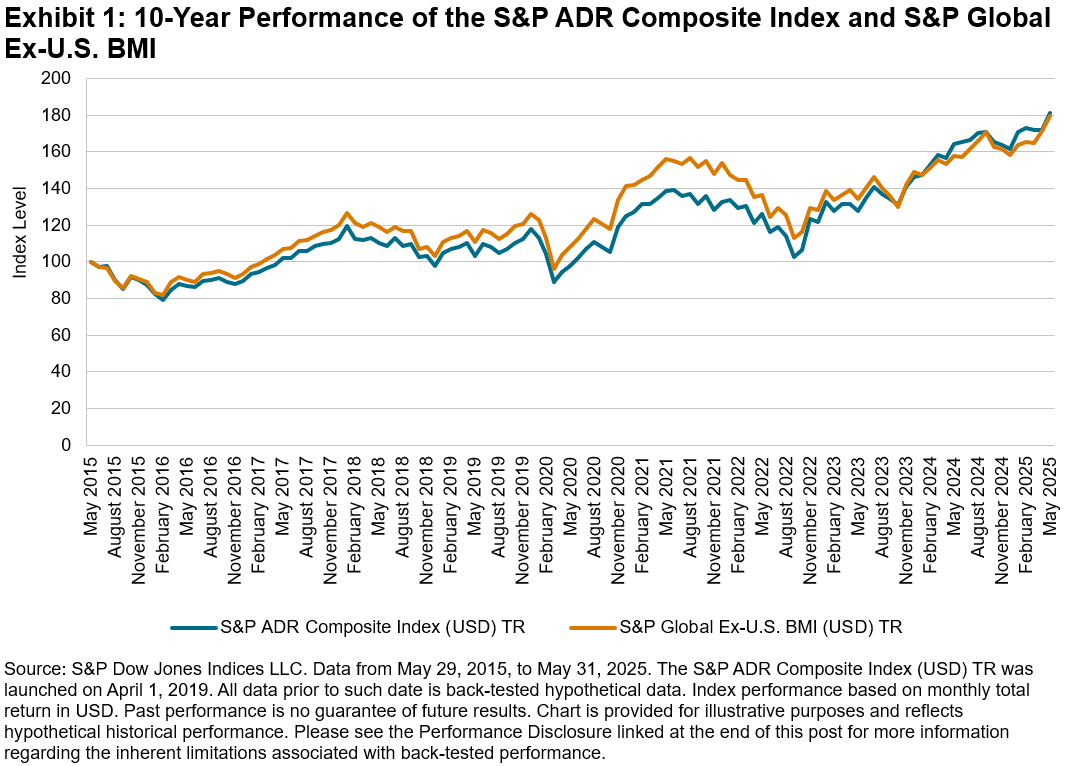
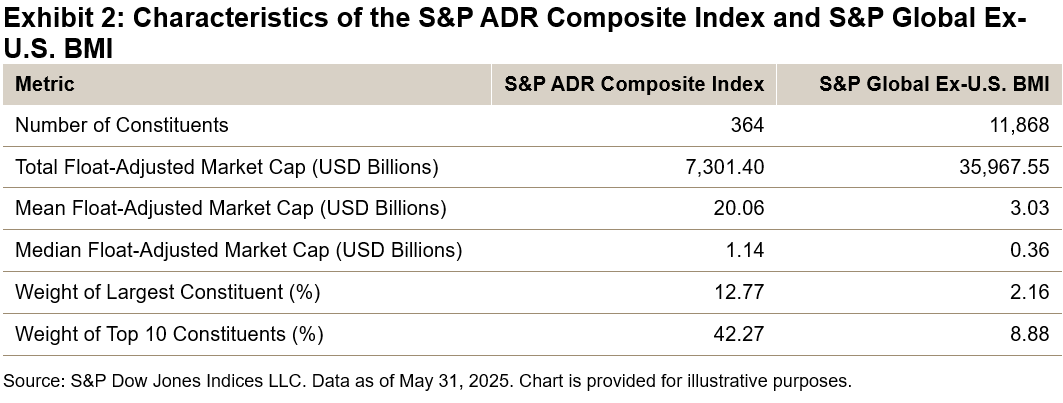
One might wonder if indices that measure these type of securities perform similarly to those that measure stocks listed on foreign exchanges. Compared to the S&P Global BMI Series, the S&P ADR Indices differ in their performance (see Exhibit 1). As not every international stock has an ADR, the number of constituents and the market capitalization of their indices has tended to be less, as illustrated by Exhibit 2. ADR indices have tended to include fewer small-cap companies, as evidenced by a higher mean and median float-adjusted market cap.

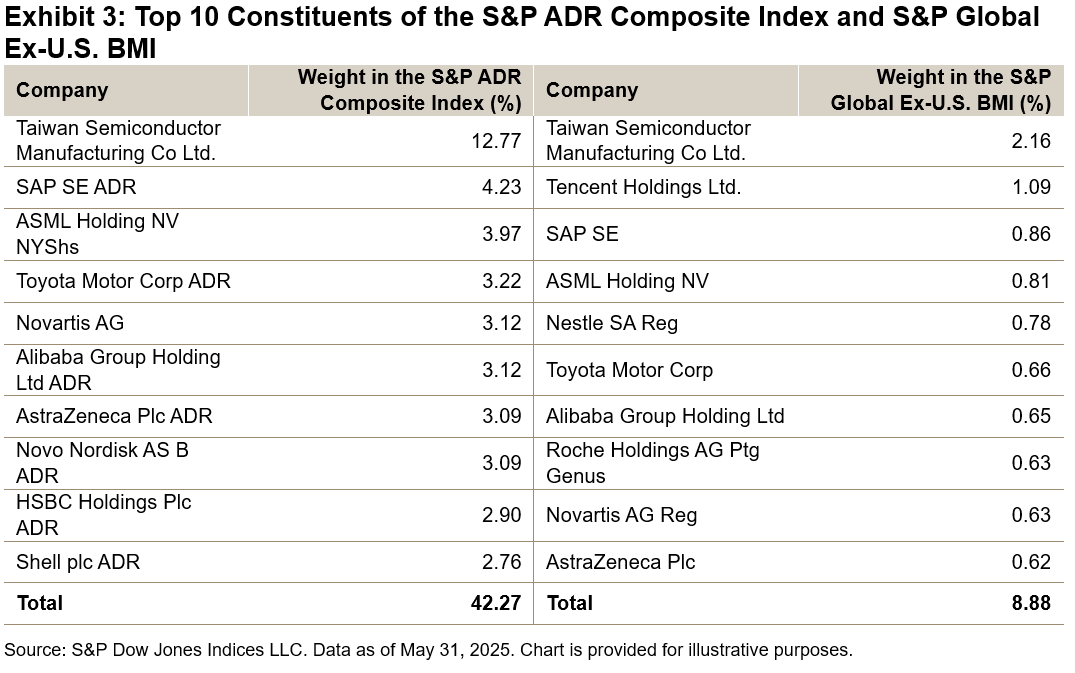
Additionally, due to the lower number of constituents, the S&P ADR Composite Index presented a higher concentration in its top 10 constituents than the S&P Global Ex-U.S. BMI. Notably, as shown by Exhibit 3, both indices share some companies as their top constituents.

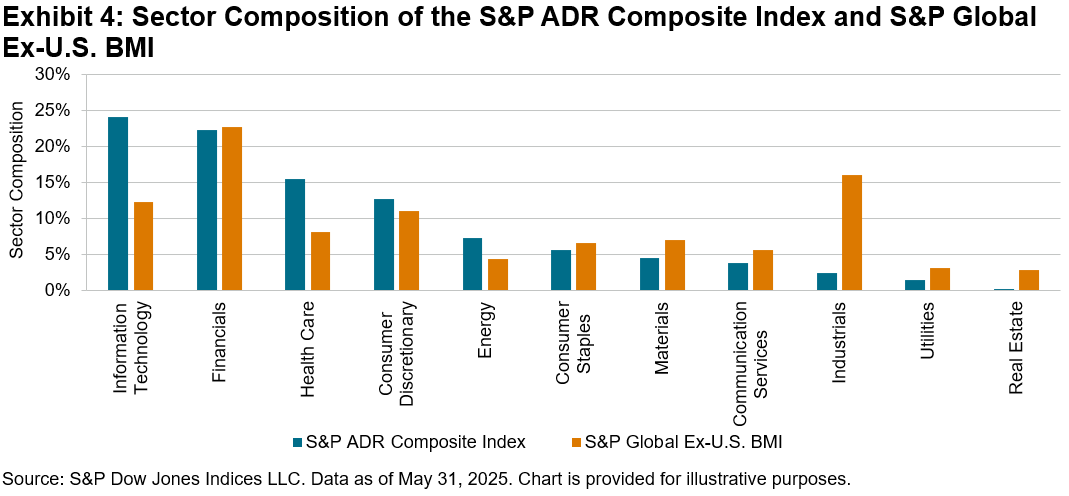
Sector-wise, the weight in Information Technology stocks in the S&P ADR Composite Index was almost twice that of the S&P Global Ex-U.S. BMI (24.1% versus 12.3%) as of May 31, 2025, making the former more concetrated in growth stocks, which might tend to perform better in bull markets, but may underperform in lower growth macroeconomic environments. On the other hand, Exhibit 4 also shows that the S&P Global Ex-U.S. BMI had a higher weight in the Industrials sector.

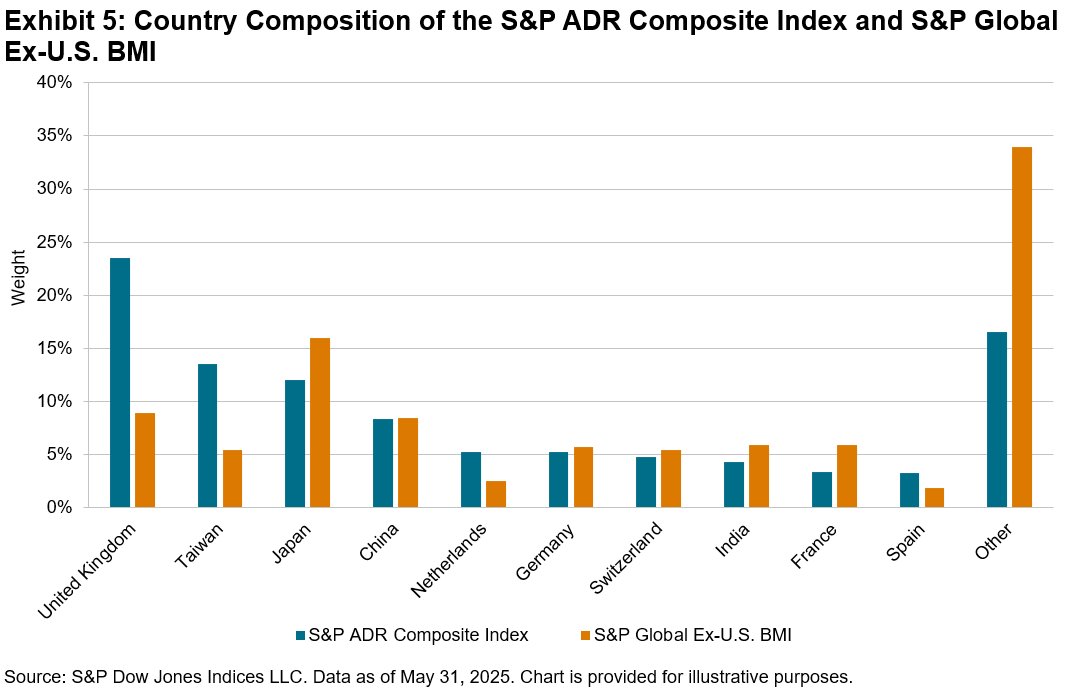
Due to variations in their country classification, the country composition of these indices differs. For instance, the S&P ADR Composite Index had more weight in the U.K. and Taiwan, while the S&P Global Ex-U.S. BMI had a bigger proportion of Japanese companies.

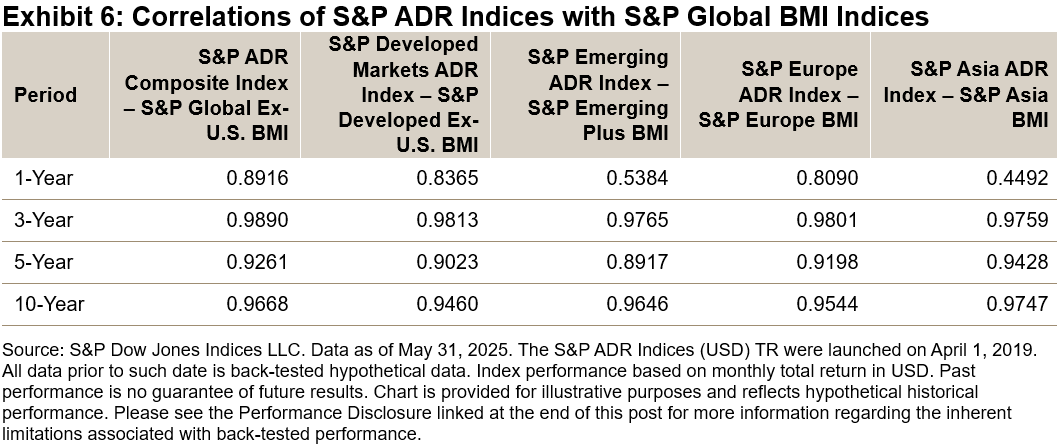
However, despite the differences in their composition and performance, historically S&P ADR Indices have shown a high correlation with their foreign-listed equities index counterparts, particularly over the long term, as Exhibit 6 shows.

In conclusion, while S&P ADR Indices differ from international indices in composition, over the the long run they have compared closely in their performance and moved in a similar trend. Based on that, and after weighting the costs and benefits of ADRs, these indices can be used to gain insight into foreign equities.

1 For further information about these securities, please see the investor bulletin published by the Securities and Exchange Commision.


Rebalance Review of the S&P Global Clean Energy Transition Index - H1 2025

Contributor Image
Abbie Zhang

Senior Analyst, Thematic Indices

S&P Dow Jones Indices

Rebalance Review of the S&P Global Clean Energy Transition Index - H1 2025

Launched in 2007, the S&P Global Clean Energy Transition Index has been a headline benchmark for measuring clean energy-related companies' performance over the past 17 years. In April 2021, we launched the S&P Global Clean Energy Select Index to measure the performance of the 30 largest companies in global clean energy businesses listed on developed market exchanges.

S&P Global Clean Energy Transition Index Rebalance in April 2025

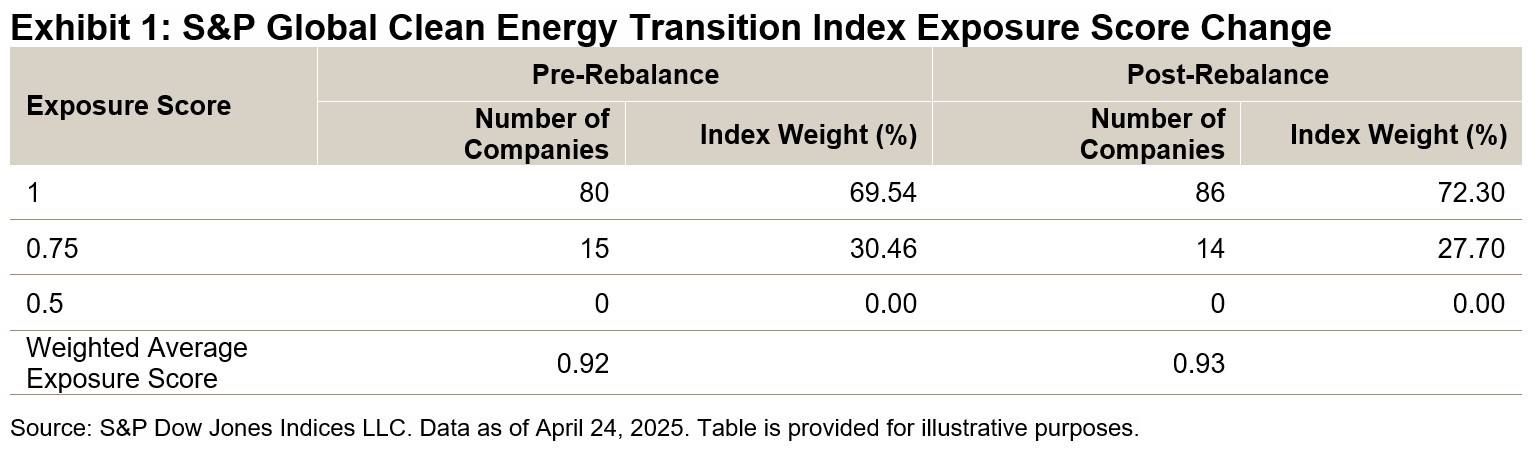
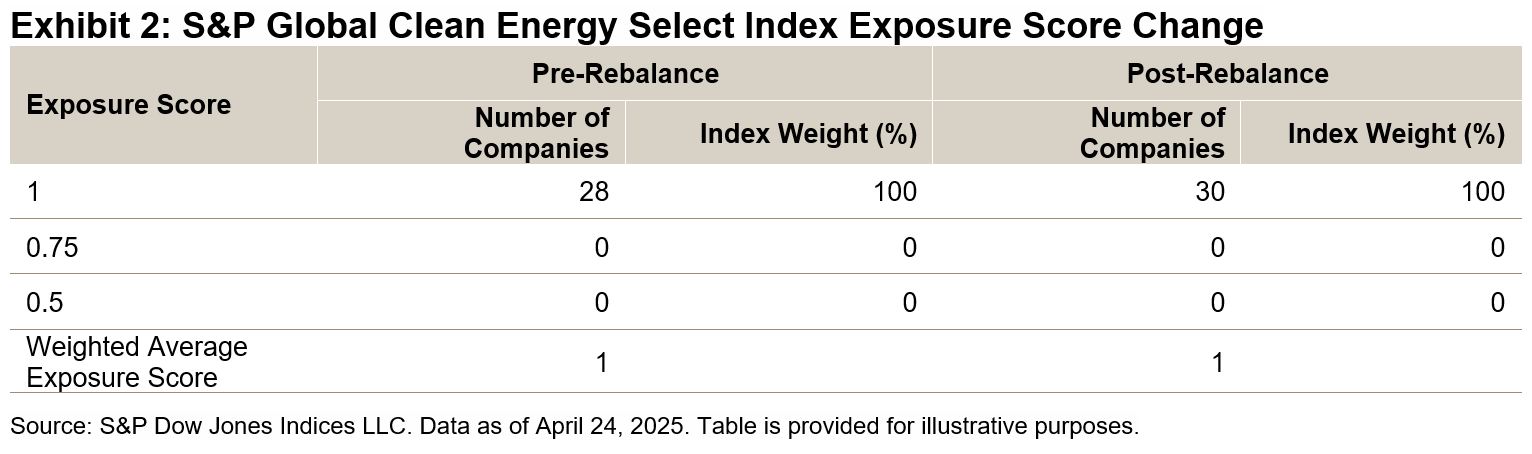
The index methodology calculates exposure scores for each company to assess their clean energy business purity, utilizing the GICS® classification system, FactSet's Revere Business Industry Classification System (RBICS) and S&P Global Trucost's power generation data. Companies are categorized into four exposure score buckets, ranging from 0 to 1 in increments of 0.25, reflecting increasing levels of clean energy business relevance. Both indices had their semiannual rebalances on April 24, 2025. Exhibits 1 and 2 show the change in exposures before and after the April rebalance for both indices.

For the S&P Global Clean Energy Transition Index, the weighted average exposure score increased slightly from 0.92 to 0.93 (see Exhibit 1). The S&P Global Clean Energy Select Index consists of 30 companies with an exposure score of 1 listed on the developed market exchanges (see Exhibit 2).

In the geographical exposure breakdown, prominent changes in the S&P Global Clean Energy Transition Index following the rebalance include a 3.67% weight increase for the U.S. and a 0.96% increase for China, alongside a 1.25% decrease for Spain. Meanwhile, in the S&P Global Clean Energy Select Index, China's weight rose by 4.37% and New Zealand's weight rose by 3.46%, while the weight of Canada declined by 2.05%.

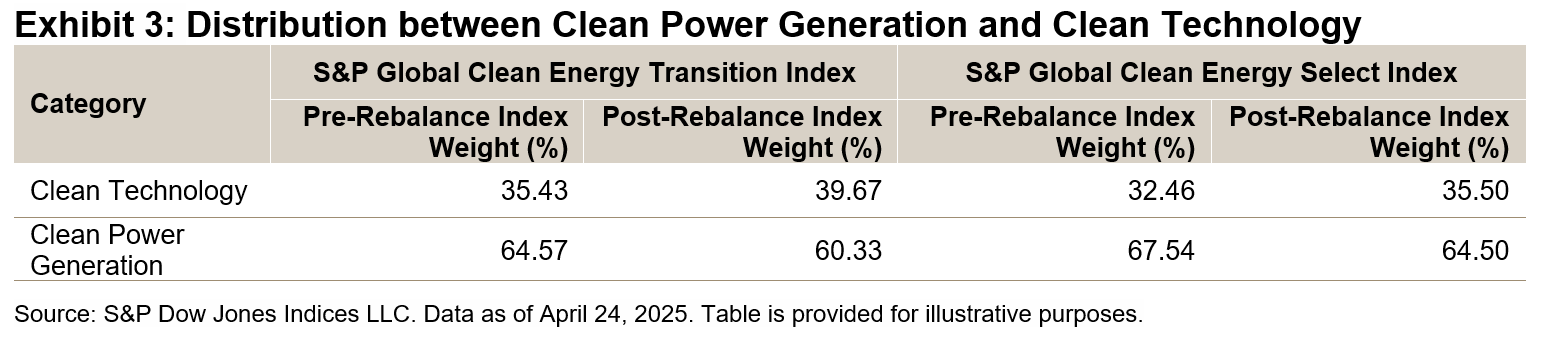
In the energy category, companies are classified into Clean Technology and Clean Power Generation based on RBICS subindustries. Clean Technology encompasses subindustries that focus on clean energy systems and manufacturing, while Clean Power Generation includes various wholesale power and electric utilities subindustries.

During the recent rebalance, the weights for clean technology increased in both indices (see Exhibit 3), primarily driven by significant gains in the weights of the Photovoltaic and Solar Cells and Systems Providers subindustries, as well as Fuel Cell Equipment and Technology Providers. Conversely, the index weight for clean power generation declined, largely due to a 1.22% decrease in the Europe Mixed Wholesale Power RBICS subindustry for the S&P Global Clean Energy Transition Index and a 1.74% decrease in the same subindustry for the S&P Global Clean Energy Select Index.

S&P Global Clean Energy Transition Index Performance YTD in 2025

As of May 30, 2025, the S&P Global Clean Energy Select Index achieved an 8.84% total return YTD in USD terms, while the S&P Global Clean Energy Transition Index gained 11.54%. Both indices outperformed the S&P Global BMI, which stood at 5.5% for the same period.

Regarding regional performance, companies domiciled in Germany within the S&P Global Clean Energy Transition Index were up 71.63% YTD. South Korea followed with an increase of 53.77%, while Brazil gained 37.61%.1

The S&P Global Clean Energy Transition Index tracks the dynamic changes in the clean energy transition and reflects the performance of clean energy-related companies, serving as a key benchmark for the global clean energy sector.

1 Source: S&P Dow Jones Indices LLC and FactSet. Data as of May 30, 2025.