






































IN THIS LIST

A Hidden Stairway to Net Zero

How Are Some Dividend Growers Outpacing Inflation and the Benchmark?

S&P DJI's Global Islamic Equity Benchmarks Rose 9% in the First Quarter, Extending Outperformance against Conventional Benchmarks

SPIVA Japan Scorecard 2023: Misfortune for Japanese Stock Pickers

Commodities Deliver Double-Digit Returns in the Face of Stubborn Inflation

A Hidden Stairway to Net Zero

"Yes, there are two paths you can go by, but in the long run There's still time to change the road you're on."

—Jimmy Page and Robert Plant

Many observers assume indices targeting broad ESG performance follow different paths than those delivering climate-focused temperature alignment. In reality, data show that modern indices can often achieve both objectives, helping investors to stride confidently down a single path of sustainability.

The S&P/B3 Brazil ESG Index measures the performance of securities meeting sustainability criteria and weights constituents based on companies' ESG performance resulting from the Corporate Sustainability Assessment (CSA) conducted by S&P Global Sustainable1.1

The index is not explicitly designed to target improved temperature alignment (a transition pathway assessment that examines the adequacy of emission reduction over time in meeting a 2°C carbon budget). However, it does address net zero energy transition objectives by applying exclusionary screenings based on business activities including thermal coal mining, coal-powered electricity generation, fossil fuel extraction and/or production using oil sands. Furthermore, under the environmental pillar of S&P Global ESG Scores, including criteria such as climate strategy and environmental policy and management, the index integrates financially relevant climate risks and opportunities.

Even without an explicit temperature alignment target, S&P DJI's Q1 2024 Sustainability Index Dashboard shows the S&P/B3 Brazil ESG Index achieved 1.5°C alignment and was 65% under its 2°C carbon budget versus the S&P Brazil BMI, which was 38% under. Such a significant result is typically only achieved in sophisticated climate indices with explicit temperature alignment targets like the S&P PACT™ Indices (S&P Paris-Aligned & Climate Transition Indices).

Exhibit 1 summarizes the sectoral contribution of the S&P/B3 Brazil ESG Index to its -65% under 2°C carbon budget status compared to the S&P Brazil BMI. A negative percentage signifies a sector's carbon emissions are under budget, while a positive percentage indicates its carbon emissions are over budget.
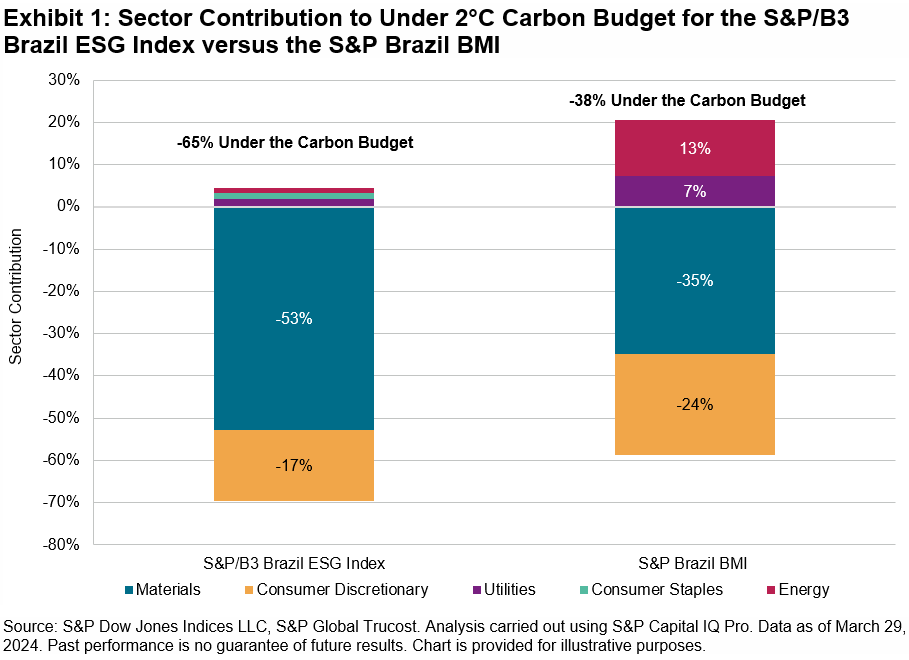
Materials was the largest contributor (-53%) to achieving -65% under 2°C carbon budget, followed by Consumer Discretionary (-17%). Energy, Consumer Staples and Utilities detracted 5% total from the carbon budget. Similarly, for the S&P Brazil BMI, Materials and Consumer Discretionary led the achievement of -38% under the 2°C carbon budget, with -35% and -24%, respectively. But these contributions were countered by Energy (13%) and Utilities (7%).

As technological developments meet sustainability considerations, the global energy system is experiencing a profound transformation. Considering the S&P/B3 Brazil ESG Index's strong temperature alignment, we evaluated types of energy generated by constituent companies (see Exhibit 2).
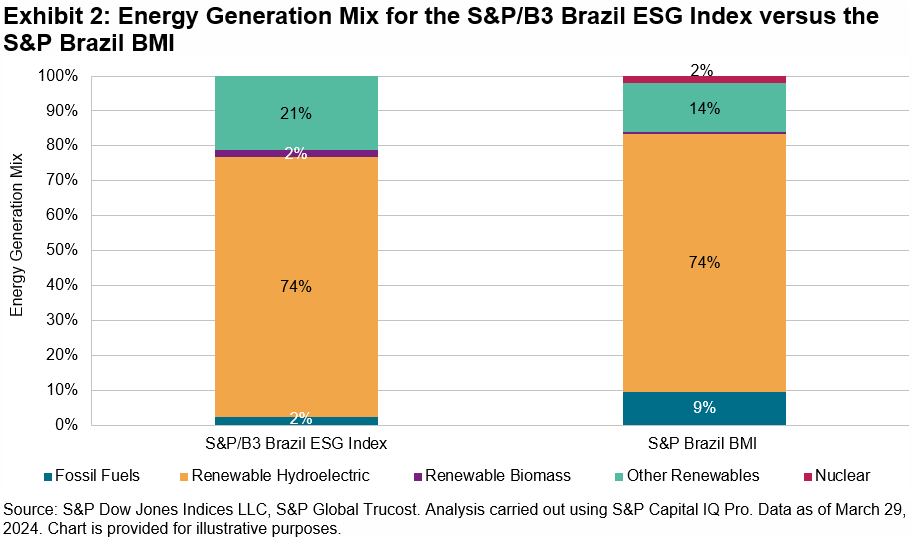
Impressively, 97% of energy generated by the S&P/B3 Brazil ESG Index constituents came from renewable sources compared to 88% for the S&P Brazil BMI. Only 2% of generated energy came from fossil fuels, including natural gas. This is also reflected in the index's 82% improvement in fossil fuel reserves compared to the S&P Brazil BMI, according to S&P DJI's Q1 2024 Sustainability Index Dashboard.

The S&P/B3 Brazil ESG Index's strong temperature alignment and energy transition outcomes could make it an interesting option for investors with multiple sustainability considerations in mind.

1 For more information, please see the S&P/B3 Indices Methodology.


How Are Some Dividend Growers Outpacing Inflation and the Benchmark?

Contributor Image
Wenli Bill Hao

Director, Factors and Dividends Indices, Product Management and Development

S&P Dow Jones Indices

With the 10-year U.S. Treasury yield hovering around 4.5%, investors may be able to find attractive yields without taking on too much risk. The challenge, however, is maintaining purchasing power relative to inflation (USD 1,000 in December 1999 was only worth USD 538 as of March 2024). For those seeking income and total returns that have historically kept pace with or exceeded inflation, high quality dividend strategies may be appealing.

With almost 20 years of live history, the S&P High Yield Dividend Aristocrats® Index tracks companies in the S&P Composite 1500® that have consistently increased their total dividends per share annually for at least 20 consecutive years.1 In this blog, we will examine the historical dividend growth and risk and return statistics for this index and highlight how it tends to track higher quality companies.

Dividend Growth, Performance and Inflation

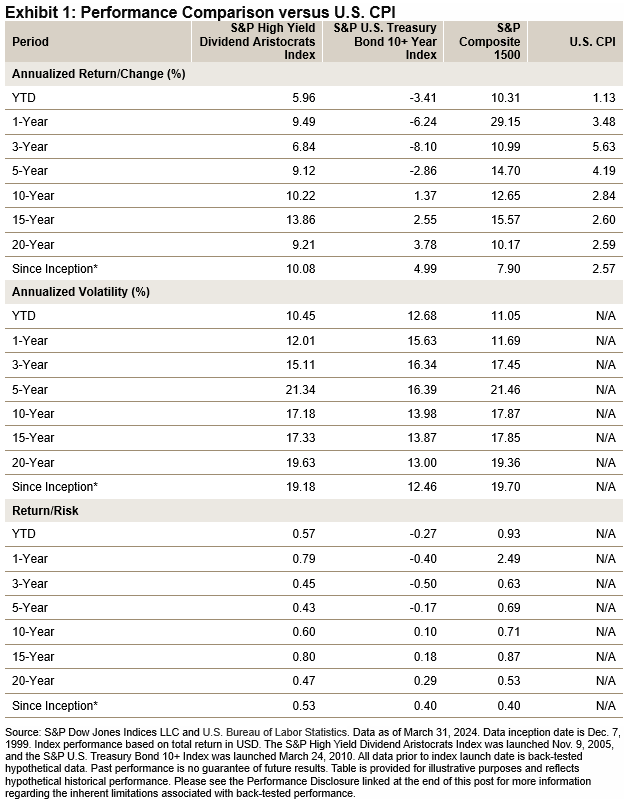
Historically, the S&P High Yield Dividend Aristocrats Index has tracked companies that have grown their dividends at a rate that has exceeded inflation over the long term. From 2000 to 2023, its dollar dividends grew at a compound annual growth rate of 4.96%, easily beating the Consumer Price Index (CPI)2 over the same period.

Given that income-oriented investors may view long-term bonds and high dividend yielding stocks as substitutes, it is important to note that the S&P U.S. Treasury Bond 10+ Year Index has lagged the CPI over the last 15 years with just a 2.55% annualized return. Meanwhile, the S&P High Yield Dividend Aristocrats Index generated an annualized return of 13.86% over the same period in addition to outperforming the CPI for all periods studied. Lastly, it has significantly outperformed its benchmark, the S&P Composite 1500, over the full period.

Long History of Dividend Increases and Dividend Growth

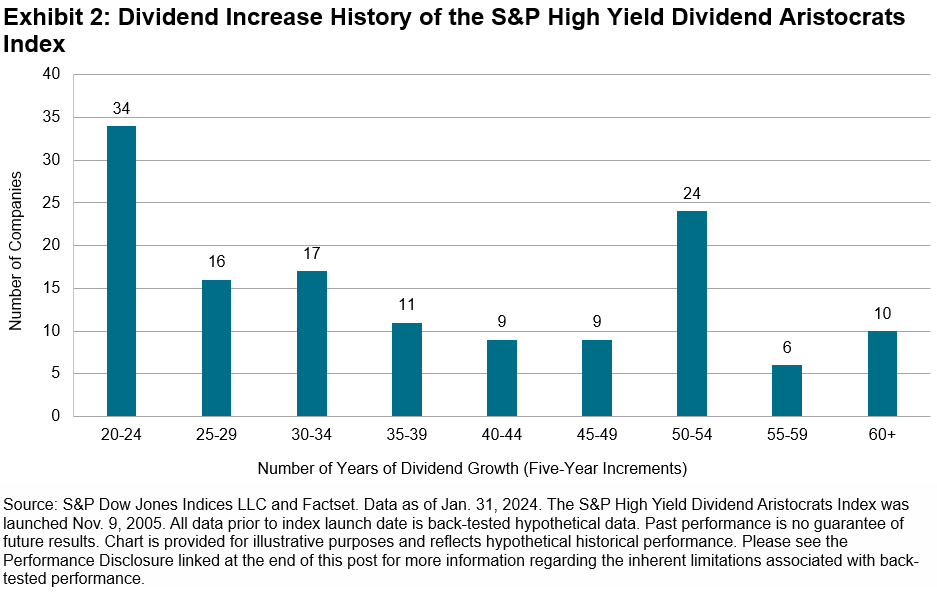
The constituents in the S&P High Yield Dividend Aristocrats Index have long histories of increasing their dividends. All constituents are required to have a minimum of 20 years of dividend increases to be included in the index, and some have a history of increasing dividends for 60 years or more (see Exhibit 2). These track records demonstrate these companies' historically consistent ability and willingness to return increasing amounts of shareholder capital across different market regimes.

Importance of Dividends and the Compounding Effect

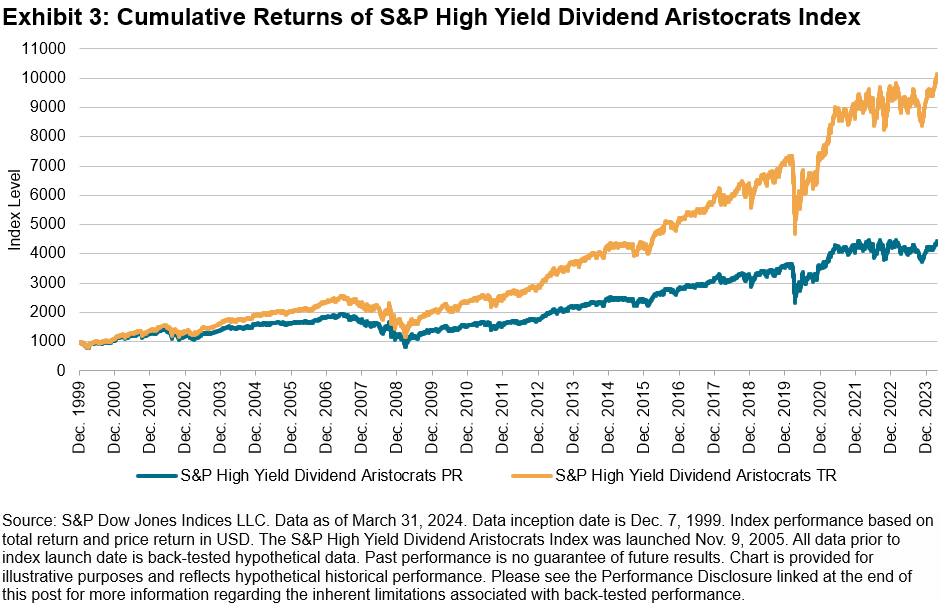
The benefits of a dividend growth strategy include compounding growth of dividends per share, compounding reinvested dividends and share price appreciation. From Dec. 31, 1999, to March 31, 2024, the S&P High Yield Dividend Aristocrats Index generated a total return of 915.47% and price return of 344.83% (see Exhibit 3). The difference (570.64%) between the total return and price return is due to the contribution of dividends.

Factor Exposure

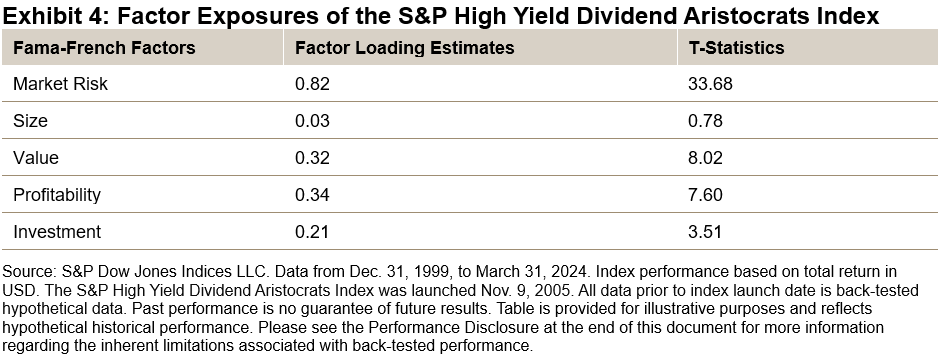
In Exhibit 4, we used the Fama-French Five-Factor Model3 to dissect the historical returns of the S&P High Yield Dividend Aristocrats Index. From the factor loading estimates and associated t-statistics, we can see that the index constituents had positive exposures to lower beta, higher value, higher operating profitability and more conservative investment growth. The empirical results show that the constituents had better quality and valuation characteristics than the overall market. High-quality fundamentals form the foundation for consistent dividend increases.

Summary

As our analyses above demonstrate, the S&P High Yield Dividend Aristocrats Index has stood the test of time when it comes to providing dividend growth that has outpaced inflation, as well as outperformance of its broad benchmark. In an upcoming blog, we will take a more tactical perspective and examine how the S&P High Yield Dividend Aristocrat Index is currently positioned due to its relative valuations versus the S&P Composite 1500.

1   For further information about the index, please see the S&P High Yield Dividend Aristocrats Methodology.

2   U.S. Bureau of Labor Statistics, Consumer Price Index for All Urban Consumers, retrieved from FRED, Federal Reserve Bank of St. Louis; https://fred.stlouisfed.org/series/CPIAUCSL, April 10, 2024.

3   Fama, E. and K. French. "Dissecting Anomalies with a Five-Factor Model." The Review of Financial Studies, Volume 29, Issue 1, 2016, pp. 69-103.


S&P DJI's Global Islamic Equity Benchmarks Rose 9% in the First Quarter, Extending Outperformance against Conventional Benchmarks

Contributor Image
Sue Lee

APAC Head of Index Investment Strategy

S&P Dow Jones Indices

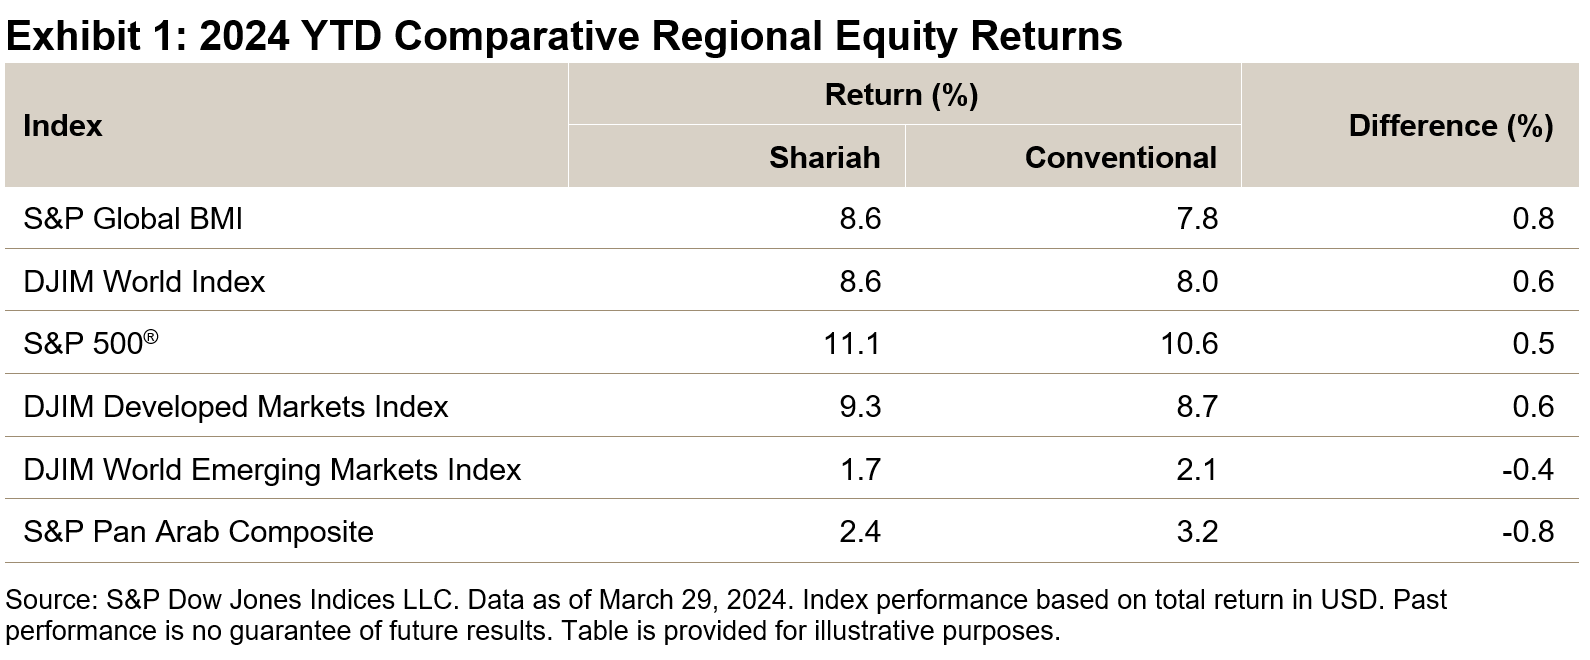
Global equities had a strong start to the year as economic resilience and diminishing recession fears boosted risky assets overall. The S&P Global BMI surged 7.8% in the first quarter, led by developed markets; notably, the S&P 500® finished the quarter up 10.6%, at a new record high. Shariah-compliant global benchmarks beat their conventional counterparts, with the S&P Global BMI Shariah and Dow Jones Islamic Market (DJIM) World Index generating an outperformance of 0.8% and 0.6%, respectively, during the quarter. The DJIM World Emerging Markets Index was a laggard, trailing behind the conventional benchmark as well as the developed market counterpart (see Exhibit 1).

MENA equities lagged along with emerging markets, with the S&P Pan Arab Composite posting a modest gain of 3.2%. Egypt was among the worst performers, with the S&P Egypt BMI falling 27.4% in U.S. dollar terms. The Egyptian pound shed over one-third of its value against the U.S. dollar during the quarter, as the country agreed on a USD 8 billion support program with the International Monetary Fund and let go of control on its currency in a bid for economic stability. GCC countries largely posted gains led by Kuwait (8.1%) and Bahrain (8.0%), while Qatar was an exception, with a 3.3% loss.

Drivers of Shariah Index Performance in Q1 2024

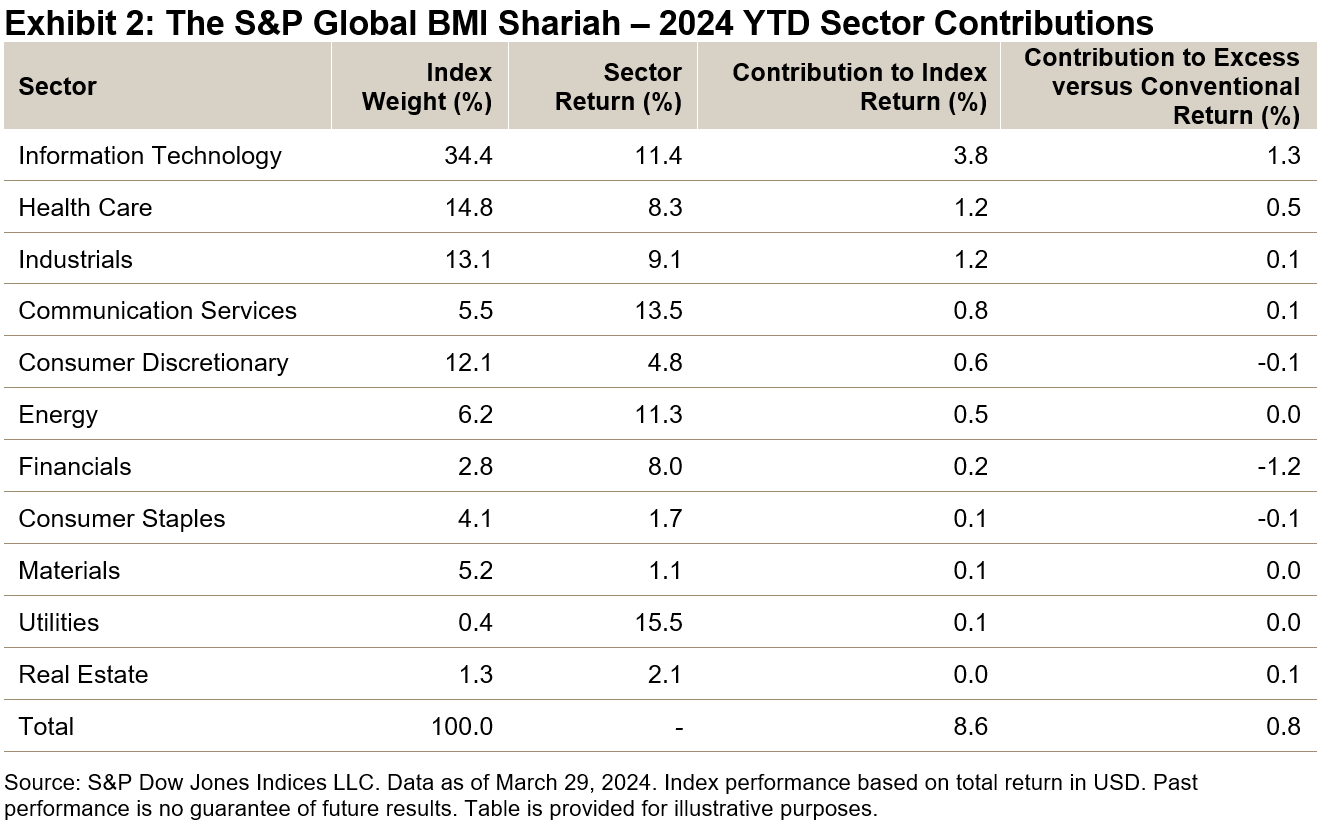
All sectors contributed positively to the S&P Global BMI Shariah in the first quarter. Extending the trend in 2023, Information Technology continued to be the largest contributor, accounting for 44% of the index return and generating an excess return of 1.3% versus the conventional benchmark. On the other hand, Financials contributed most negatively to the relative performance, with an excess return of -1.2%, due to its lower weightings as compared to the conventional benchmark (see Exhibit 2).

Global Sukuk Fared Better than Bonds in Q1 2024

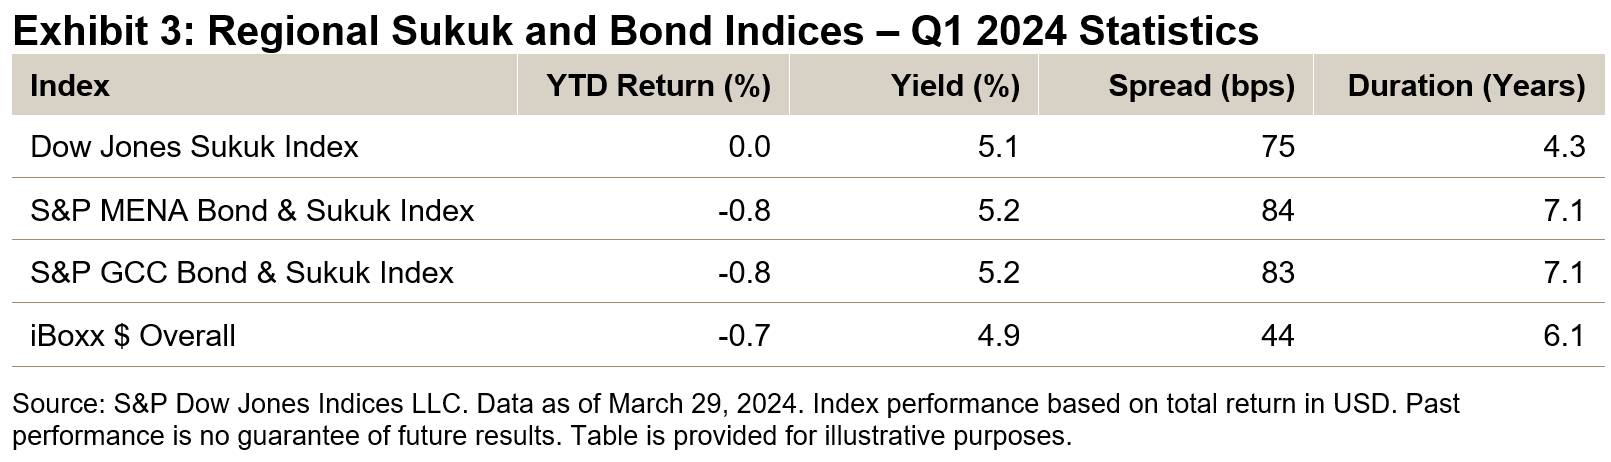
The Sukuk market was largely muted, with a close-to-zero gain in the first quarter as measured by the Dow Jones Sukuk Index. The benchmark outperformed the regional MENA and GCC Bond & Sukuk benchmarks as well as the global iBoxx USD Overall, as shorter-dated securities generally outperformed longer-dated ones during the quarter.

This article was first published in IFN Volume 21 Issue 16 dated April 17, 2024.


SPIVA Japan Scorecard 2023: Misfortune for Japanese Stock Pickers

Contributor Image
Sue Lee

APAC Head of Index Investment Strategy

S&P Dow Jones Indices

Since the first publication of the S&P Indices Versus Active (SPIVA®) U.S. Scorecard in 2002, S&P Dow Jones Indices has regularly reported on the relative performance of actively managed funds versus benchmark indices across an increasing number of global fund markets and fund categories.1

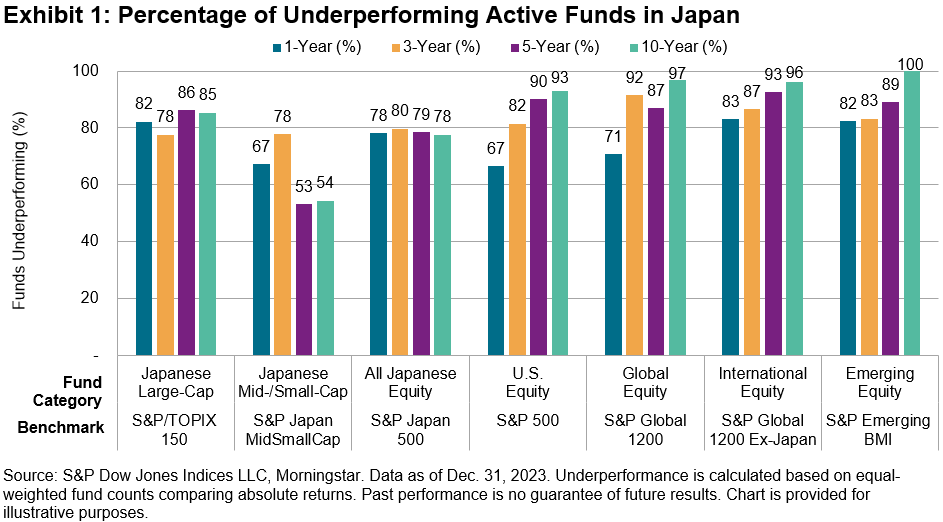
The SPIVA Japan Scorecard has been tracking the performance of active funds offered in Japan since 2014, covering large-, mid- and small-cap segments, as well as international and global equity funds. Over these years, we found that a significant majority of active funds in Japan underperformed their assigned benchmark in each of our reported fund categories. Exhibit 1 summarizes the underperformance rate of active funds in Japan over the 1-, 3-, 5- and 10-year periods ending on Dec. 31, 2023, across different fund categories.

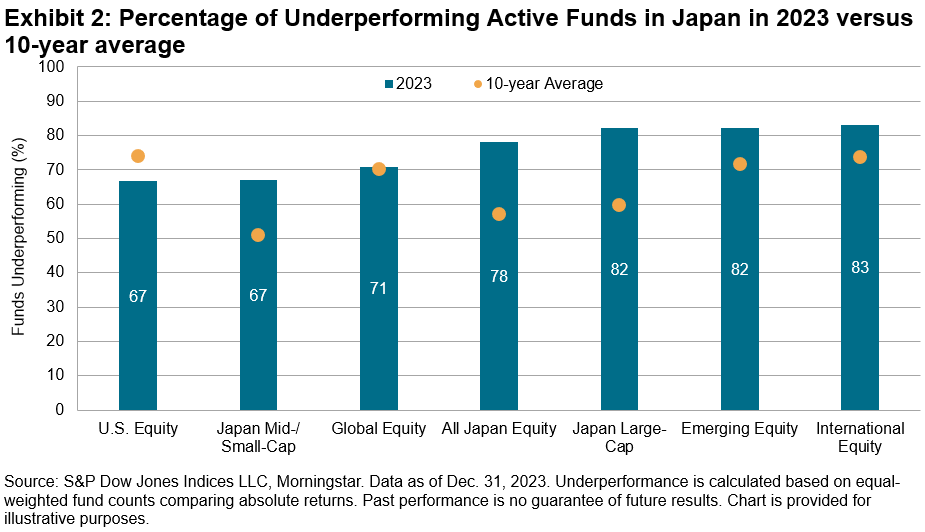
While 2023 marked an epic turnaround for Japanese equities with a reprieve from long-suffering deflation, it was a challenging year for Japanese active managers. 78% of Japanese domestic equity funds (All Japan Equity category) underperformed the broad-based S&P Japan 500 over the full year 2023. Furthermore, over two-thirds of equity funds underperformed their benchmarks in every reported category, posting underperformance rates worse than their 10-year averages in nearly all categories except for the U.S. Equity (see Exhibit 2).

What could explain last year's misfortune of Japanese active fund managers? Among many possible explanations, we found three market conditions that posed challenges for active managers.

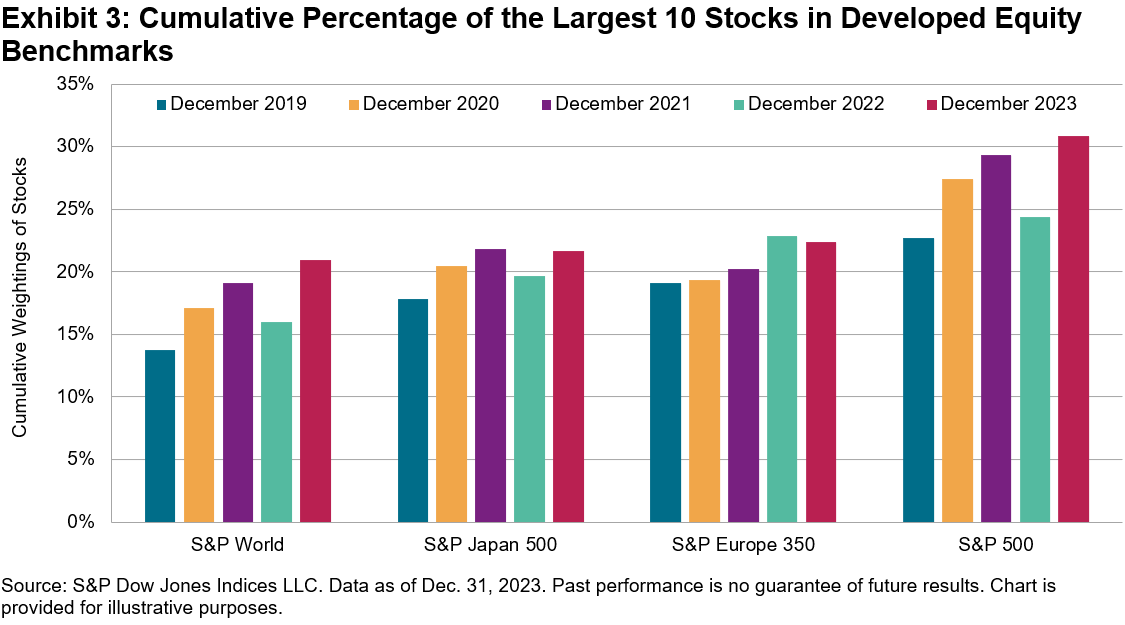
  1. Large-cap outperformance: The outperformance of large-cap companies was one of the key market trends in 2023. This was well publicized in the U.S. market with the so-called "Magnificent Seven," namely Apple, Amazon, Alphabet, Meta, Microsoft, Nvidia and Tesla, which contributed 58% of the S&P 500®'s return in 2023. Similarly in Japan, the large-cap S&P/TOPIX 150 outperformed the S&P Japan MidSmallCap by 4% in 2023, resulting in increased market concentration (see Exhibit 3). This environment would have worked against active managers who searched for a source of outperformance among smaller, lesser-known names.
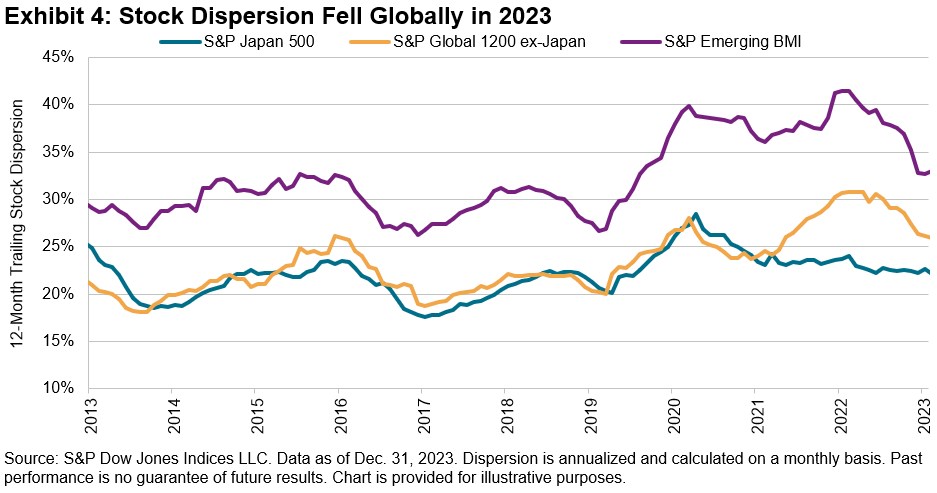
  2. Falling dispersion: Dispersion,2 the degree to which stocks differ from the average performance, measures the opportunity set for active managers to outperform through stock selection. Dispersion moved lower globally in 2023, though it remained elevated relative to its history (see Exhibit 4), which points to reduced opportunities for active managers overall.
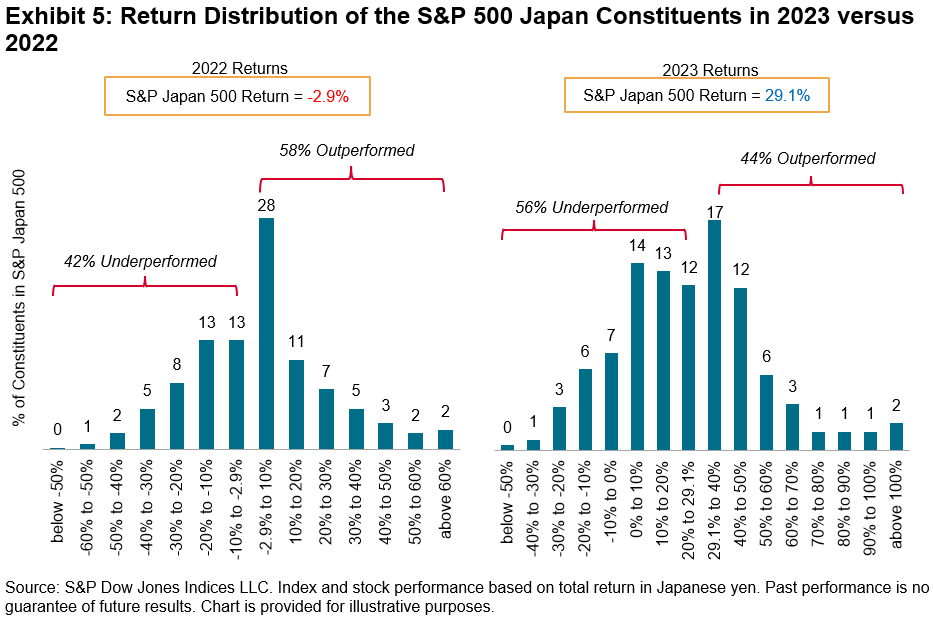
  3. Return distribution: Stating the obvious, when fewer stocks outperform the benchmark, it becomes less likely for managers to find them. In 2023, the percentage of constituents outperforming their benchmark fell well below 50% across domestic and global benchmarks amid a strong market rally. In Japan, the percentage of constituents outperforming the S&P 500 Japan dropped from 58% in 2022 to 44% in 2023 (see Exhibit 5).
To learn more, we invite you to explore the results of our SPIVA Japan Year-End 2023.

1 See SPIVA Around the World and SPIVA Fixed Income Around the World for the latest results of equity and fixed income funds across all covered markets.

2 See Tim Edwards and Craig J. Lazzara, "Dispersion: Measuring Market Opportunity," S&P Dow Jones Indices LLC, 2014


Commodities Deliver Double-Digit Returns in the Face of Stubborn Inflation

Commodity markets remain on top of the asset class leader board with inflation drawing the ire of the Fed and other asset classes. The upside surprise in U.S. inflation spotlights the potential benefits of commodities as a diversification tool. The S&P GSCI, the leading indicator of broad commodity performance, has produced double-digit returns in 2024, currently up 12.8% following the uptick in consumer prices. Gold continues to reach all-time highs, surpassing USD 2,344 per troy ounce while cocoa is the best-performing commodity, nearly tripling over the past year. Both components are included in the S&P GSCI, helping produce a diversified exposure to the broad commodity market. For perspective, bitcoin has captured sizable flow into ETFs, and the S&P Bitcoin Index is "only" up 140%, less than half of what cocoa has done in the same period. The S&P GSCI has benefited from holding gold and cocoa, but oil is the largest component and has delivered the strongest historical sensitivity to inflation. The petroleum sector within the S&P GSCI is up 21.4% YTD, with precious metals up 13.2%. In this post, we review the last half century of commodity performance, which covers inflationary regimes and central bank responses.

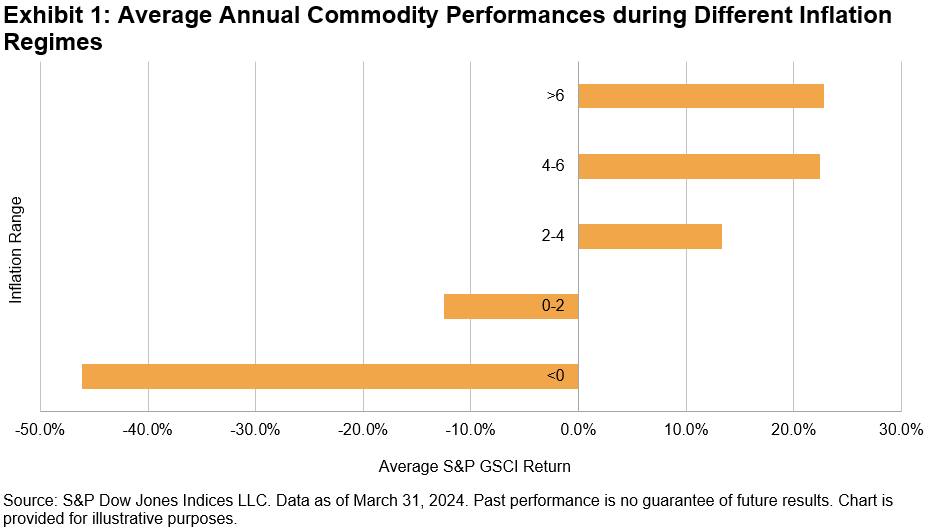
Commodities have done well when inflation remains elevated, and the Federal Reserve maintains a defensive posture. Breaking inflation into low, medium and high inflationary environments, commodities have experienced double-digit annual gains when inflation exceeds 2%. The average one-year return when inflation measures between 2% and 4% is 13.3%. Exhibit 1 shows the breakdown by inflationary tiers.

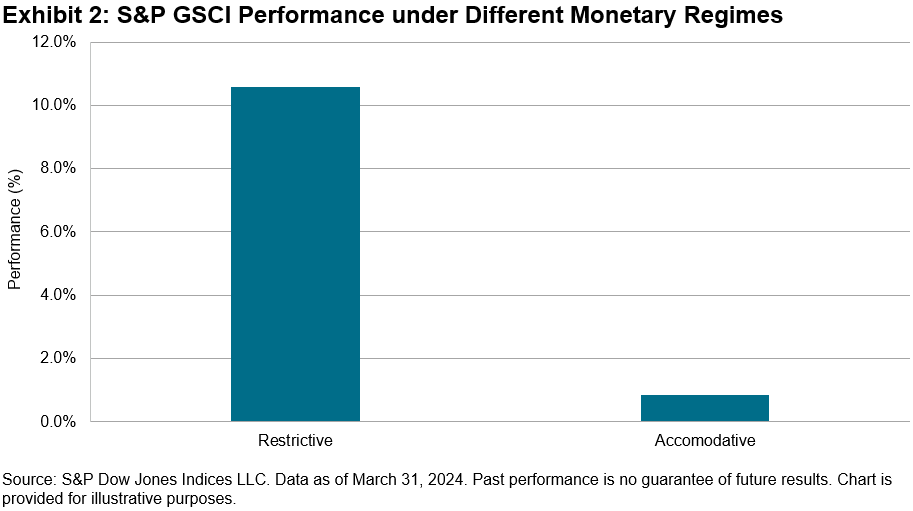
Another way to measure commodity performance is when the Fed maintains a restrictive stance, defined by the Fed Funds Effective Rate exceeding target inflation of 2%. Again, going back the full history of the S&P GSCI to 1970, we measure the annualized returns during such periods and compare that with accommodative environments. The S&P GSCI achieved average annualized returns of 10.6% over the 39 years when the Fed Funds Effective rate was above 2%. This compares favorably to 0.9% average annualized returns during the 16 years the Fed held the effective rate below 2%. We recently covered this in a blog post, and updated the data through April in Exhibit 2.

A broad basket of commodities has historically helped provide diversification and inflation protection. Unlike traditional asset classes such as stocks and bonds, commodities have unique risk and return characteristics that are often uncorrelated with other investments. The S&P GSCI's 10-year correlation to the S&P 500® is 0.4, while its correlation to the S&P GSCI Gold component is zero and it has a negative correlation of -0.16 to the S&P U.S. Aggregate Bond Index. Including commodities could help reduce overall volatility and enhance risk-adjusted returns by spreading risk across different asset classes. Additionally, commodities have historically exhibited a positive correlation with inflation, making them a possible hedge against rising prices. As prices for commodities tend to rise during inflationary periods, broad-based commodity indices like the S&P GSCI have demonstrated low correlation to other asset classes as well as positive performance correlation to persistent inflationary environments.