S&P Global Offerings
Featured Topics
Featured Products
Events
S&P Global Offerings
Featured Topics
Featured Products
Events
S&P Global Offerings
Featured Topics
Featured Products
Events
Banking & Capital Markets
Economy & Finance
Energy Transition & Sustainability
Technology & Innovation
Podcasts & Newsletters
Banking & Capital Markets
Economy & Finance
Energy Transition & Sustainability
Technology & Innovation
Podcasts & Newsletters
S&P Global Offerings
Featured Topics
Featured Products
Events
Blog — 15 Jun, 2022
At ChartIQ, our mission is to provide innovative trading solutions that our clients can seamlessly incorporate into their platforms with minimal effort. This makes our clients (and their clients) successful. The newest addition to our family of state-of-art features is SignalIQ.

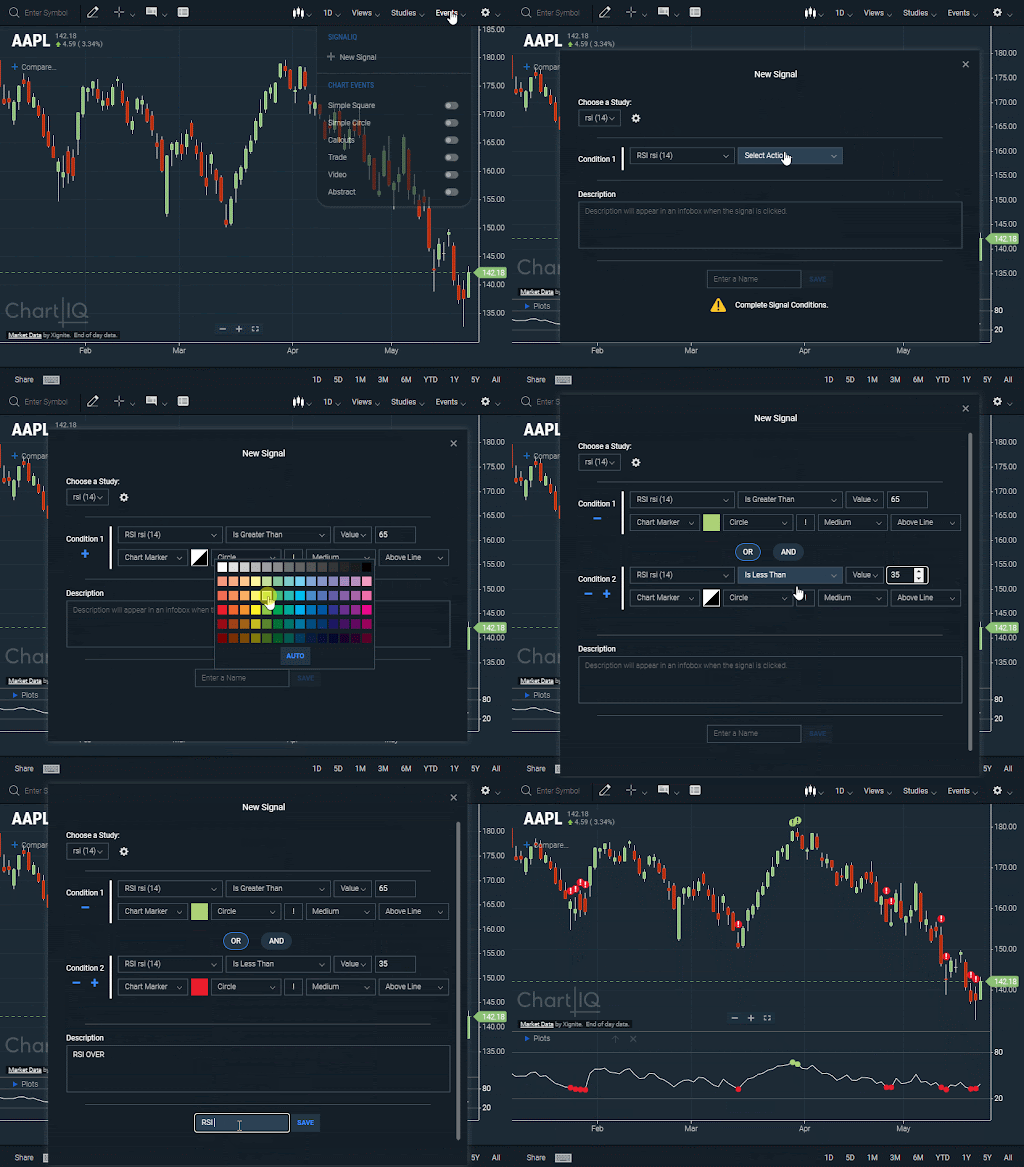
A part of our award-winning ChartIQ Technical Analysis platform, SignalIQ takes event markers to another level, allowing traders to:
Prioritizing studies is a high priority for us as our clients seek to provide a charting solution for traders of all levels. With 125+ studies, including MACD, RSI, Bollinger Bands, and Alligator, traders have everything they need to make smart trading decisions. With SignalIQ, traders can use any study to fire on-chart signals as they happen, or evaluate the historical behavior of these signals.
Before, if traders wanted to mark when a study passed below a certain value, they would have to make a drawing to indicate where this happened. There was no support for real time signal displays, and traders would have to watch the values of individual lines using the crosshair to see if they intersected. This came to be problematic, and when a client brought this to our attention, our team responded. Nearly 60% of our roadmap can be attributed to client requests, and SignalIQ came directly from that client request.
If a trader wants to track when a study hits a certain value or interacts with another component of the study, a marker will be displayed on the chart in real-time. The trader can even hide the study and have it monitor the activity in the background, which is particularly useful on mobile devices with limited screen real estate.
Anybody who’s interested in technical analysis will appreciate SignalIQ. It allows traders to see when a study signal occurred and how the market behaved following these events. TA traders often monitor many securities at once, and can now use SignalIQ to receive clear visual signals to reduce the time spent reviewing a chart.
Additionally, SignalIQ is an important piece in teaching traders how to be more responsible. The ability to recognize and annotate important patterns in the chart—rather than a notification which simply vanishes—contributes to the historical analysis and traders can learn from past mistakes and/or strategize for the future based on these signals.
The visualization is truly unique. With the newest iteration of SignalIQ, we now offer paintbar support (in addition to markers) which are very effective for highlighting conditions that tend to persist over time.
This is now an option for each signal the trader creates.

No other TA platform separates signals out from studies. Some may allow signals on studies that are already on the chart, but we’ve sidestepped this by allowing the signals to do their job in the background without necessarily having to stay on the chart. We recognize that charts can quickly get noisy and busy, but we want to eliminate that noise where possible.
It’s important to note that SignalIQ is available at no additional cost to those who have our Technical Analysis module. This new feature demonstrates how we continue to evolve the product so that our clients can focus on their core competencies and not building TA tools. Any trader who does serious charting analysis will benefit from this next logical step in a TA solution.
As we evolve our product, your solution evolves. We’re proud that ChartIQ allows you to advance your technical analysis solution without making a significant engineering investment. We do the hard work for you, keeping you (and your clients) up-to-date, competitive, and confident that they have access to the best charting tools on the market.
