


ARTICLES & REPORTS — Feb 05, 2024
S&P Global, European Loan Volume Survey: Q4 2023
By Alex Johnson and Georgie Slater
Highlights
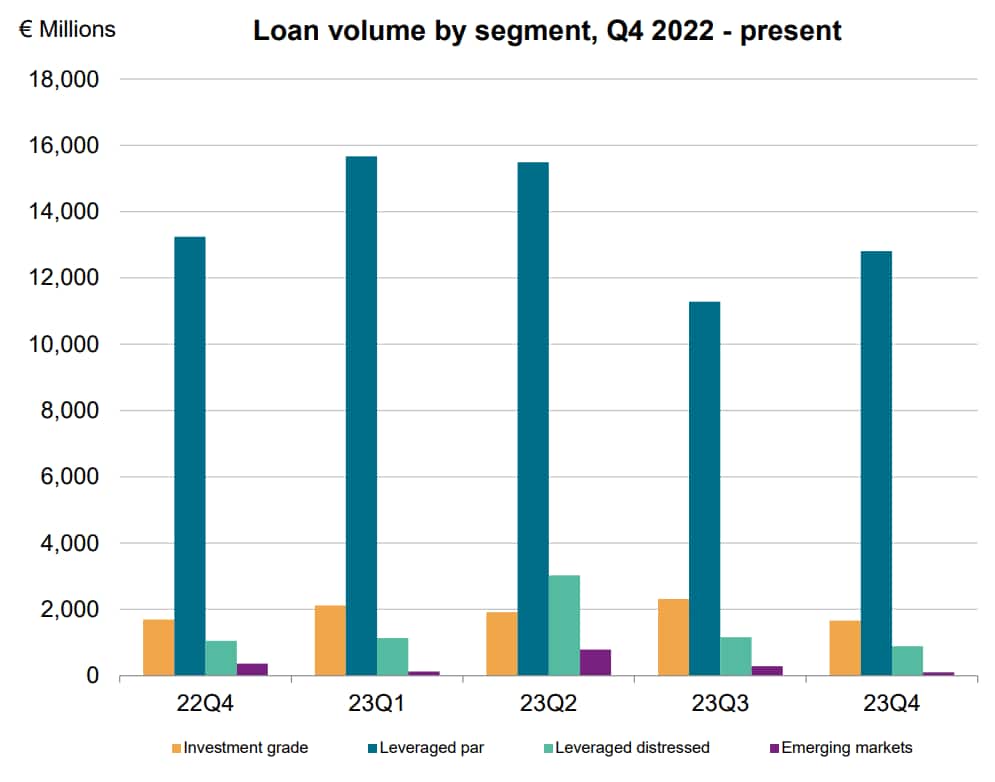
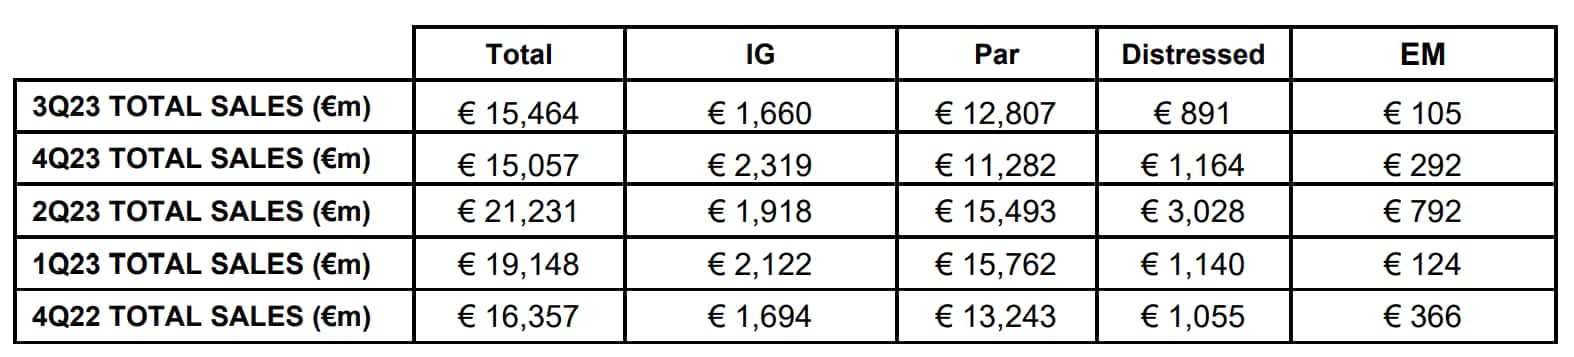
Total Volumes for Q4 2023 (€15,464m) were up by 2.7% from the €15,057m for Q3 2023. The quarter was down by 5.06% on the €16,357m in Q4 2022.
- Leveraged loan trades in Western Europe constituted 88.58% of total volume, significantly down on the 82.66% observed in the previous quarter and lower than the 87.41% in Q4 2022. Of the 88.58% this quarter, 82.82% was conducted on LMA Par documentation and 5.76% on LMA Distressed documentation.
- European Investment Grade loan volumes represented 10.74% of the total, slightly higher than the 2022 fourth quarter of 10.35% yet lower than Q3 2023 of 15.4%.
- Emerging Market figures (EEMEA) saw another significant drop off and represented just 0.68% for Q4, which is significantly lower than the 1.94% we saw in Q3 2023, yet slightly down from the 2.24% from the fourth quarter of 2022.
Survey results
Par figures were significantly up by 13.5% to €12,807m in Q4 2023 from €11,282m in Q3. This also represents a 19.04% decrease on the €13,243m in Q4 of 2022. There was a substantial decrease in the Distressed sector moving down by 23% from €1,164m in Q3 2023 to €891m in Q4 2023. This was also down by over 15% on the €1,055m Q4 2022. Investment Grade figures down by 23.4% last quarter at €1,660m compared to the €2,319m in Q3 2023 slightly down by 1.9% on the €1,694m Q4 last year. Emerging Markets continue to be significantly down, by 64% from €292m in Q3 2023 to €105m in Q4 2023 and down 71.3% against the €366m from Q4 of 2022.
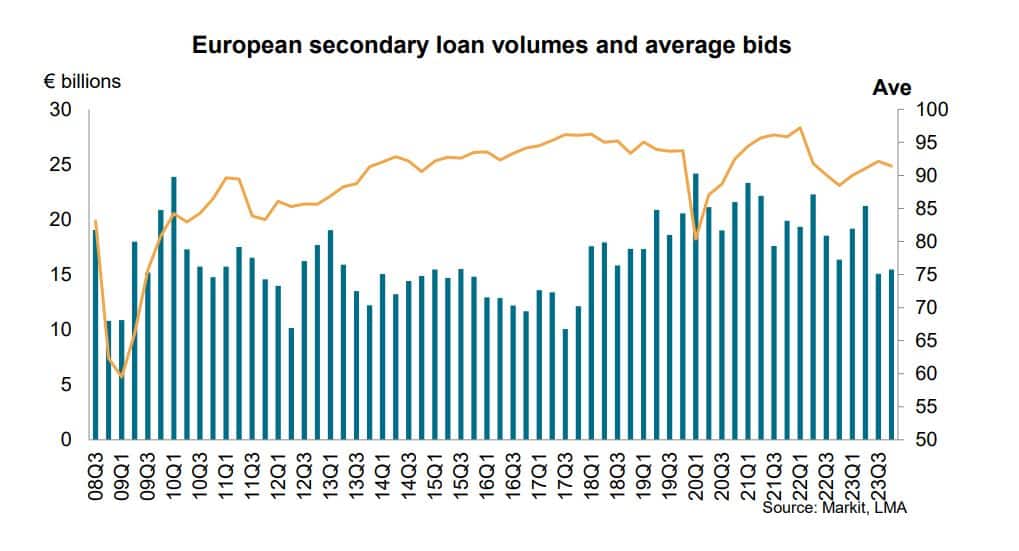
The average bid as of the end of Q4 was 92.41, which is up from the 92.34 observed at the end of Q3 2023 and significantly up from 88.55 in Q4 2022. The average bid over the quarter was 91.39, which was lower than the 92.11 of Q3 2023 and higher than the 88.479 of Q4 2022.
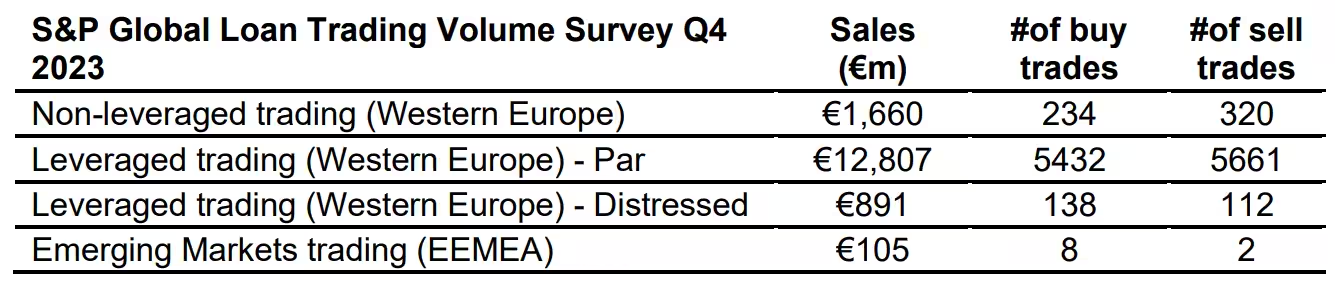
Number of trades by market segment
Breakdown by participation
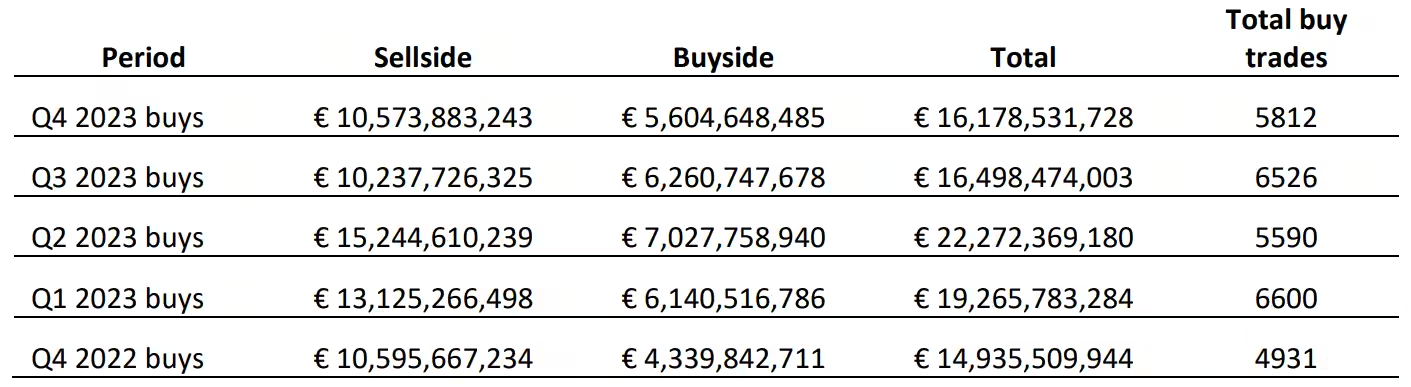
Total buy volumes in Q4 2023 were relatively stable, down slightly by 1.9% from €16,498m in Q3 2023 to €16,179m last quarter. Sellside buy volumes were up by 3.3% from €10,237m in Q3 2023 to €10,573m in Q4 2023. Buyside buy purchases were down by 10.5% in the same period, €6,260m to €5,604m. The number of actual buy trades has decreased by 11% from 6526 in Q3 2023 to 5812 in the last quarter.
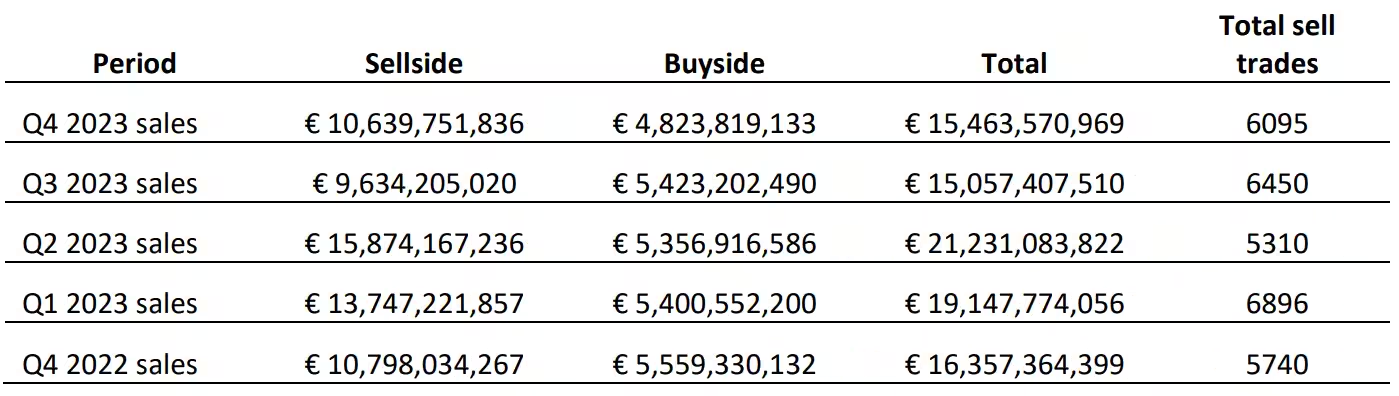
For the sale volumes, the sellside volumes were up by 10.4% from €9,634m in Q3 2023 to €10,639m in Q4 2023. In the same period, buyside volumes were down 11% from €5,423m to €4,824m. The total number of sales between Q3 2023 and Q4 2023 were up by 2.7% from €15,057m to €15,464m. The total number of sell trades in Q4 2023 was 6095, down 5.5% from the previous quarter's 6450.
Contributors
A total of 21 buyside and sellside institutions participated in this survey.
- Anchorage Capital
- Crédit Agricole
- JP Morgan
- Barings (U.K.) Limited
- Credit Suisse
- KKR Credit
- Bank of America
- GSO Capital Partners
- M&G
- Barclays Capital
- ICG
- Morgan Stanley
- BNP Paribas
- Invesco
- NatWest Markets
- Commerzbank
- Investcorp Credit Management
- Nomura
- CQS
- Janus Henderson Investors
- Société Générale
For more information, please contact:
Georgie Slater
S&P Global Fixed Income Pricing
+44 20 3367 0317
Alex Johnson
S&P Global Fixed Income Pricing
+44 20 7260 2491
Rory McSwiggan
S&P Global Fixed Income Pricing
+44 20 7064 6404
For further information
S&P Global provides industry-leading data, software and technology platforms and managed services to tackle some of the most difficult challenges in financial markets. We help our customers better understand complicated markets, reduce risk, operate more efficiently and comply with financial regulation.
This article was published by S&P Global Market Intelligence and not by S&P Global Ratings, which is a separately managed division of S&P Global.