


BLOG — Aug 23, 2021
Lost in TV – Sport Season on Screen

The reference data used for this article is based on statistical and transactional datasets within the Global Trade Analytics Suite (GTAS) solution from IHS Markit Maritime & Trade.
Introduction
Postponed by a year, the long-waited Olympic Games finally opened up this summer, though in midst of ongoing pandemic and restriction measures; earlier, other events including EURO Cup and Copa America football games have been igniting sports fans. With restriction measures in place, only few are able to present at the stadia, however, advanced live streams broadcasting allow people to follow the events in real time, in front of screens.
This could bring up demand for some product, for example television and screens. As some already seen in news reports that sales of TV surged in Japan, which seems bitter-sweet for this sector. In the post, we take HS 852872 (Reception Apparatus For Television, Color) as an exemplifying item to navigate its trade from various angles and granularity levels. EU and US, two of the largest import markets, have both seen volume and unit price increases. The two markets shared mainland China being a major import origin, but differ in terms of the 2nd largest for 'near-shore' supply. Import seasonality could mean an upcoming peak in transport demand; while the variety of transport modes may help at a time of marine capacity shortage. Global trade monitoring is underpinned by analysis at the micro-level, as some top multi-national television companies' supply chain footprints are the ultimate force shaping international trade.
These observations demonstrate how trade data analytics may help various industry participants for their respective objectives and interest, and of course is applicable to any commodities.
Top Markets and Recent Developments
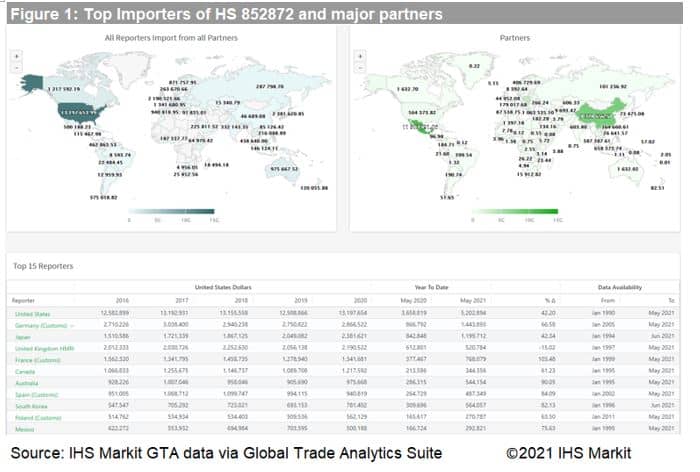
The below world map analytics provided by GTA statistical data within the Global Trade Analytics Suite (GTAS) gives a visualization. Globally, the largest import markets for television (HS 852872) are the US and EU. In 2020, the number of US imports stood at 3.79 million, amounting to $948.32 million, while the number of EU imports was 8.78 million, amounting to $1.17 billion. With available data reported through May 2021 (the month before major sport events kicked off), it is observed that all top importing countries except UK have recorded a two-digit growth in television imports compared to the same period in 2020.
Looking at the import trade partner map, mainland China and Mexico appear as the top two exporters. It is also noticeable that within the EU, Poland is a main import origin for other member states.
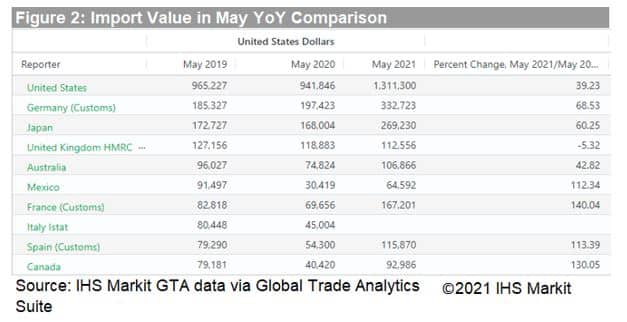
Comparing to pre-pandemic, monthly import momentum in May 2021 is still at a high level. As Figure 2 shows, the US imports in this single month has exceeded one million, up 39.23% year-on-year. Some reporters, for example France and Spain, doubled imports of this item in May 2021, comparing to last year same period.
The lock-down measures, including restricted number of audiences present at stadia, could have stimulated the demand for live stream and thus television / screen products. Yet we may not neglect that trade value is a result of two elements, volume and unit price - change in either factor would suppress or inflate the import trade value indicator.
Trade Partner
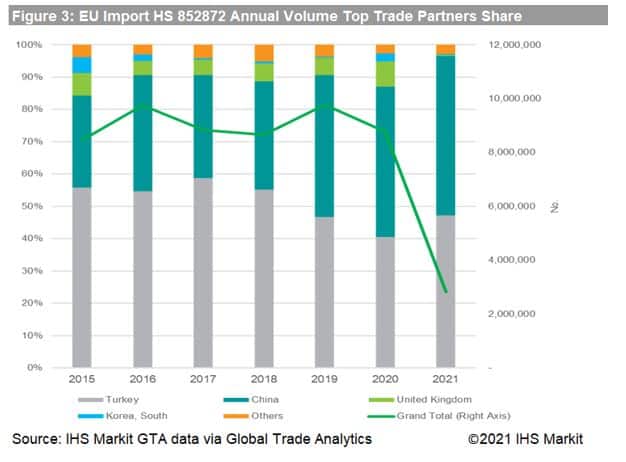
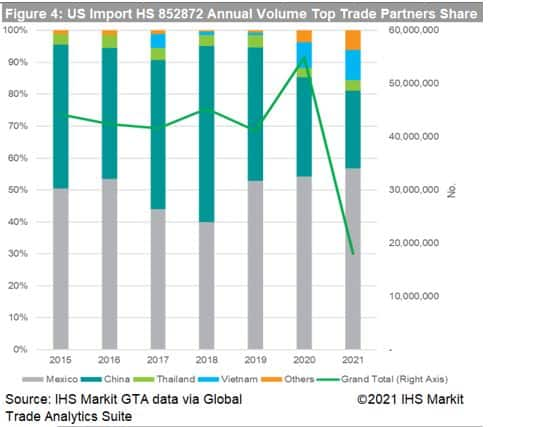
Trade statistics data help us further zoom into the import origin structure for the two markets, EU and US, respectively. Mainland China remains to be a major exporter for both markets, share in EU's import volume is expanding and a reverse trend observed for US in recent years. Yet when it comes to the other largest trade partners, the US and EU diverge with Mexico and Turkey being key origins, respectively. It is also observed that Vietnam emerges as an exporter for the US market, despite mainland China's major share. Considering the geographic adjacency, this may possibly imply a mixture of off-shore and near-shore supply structure.
Transport Mode Implication
In general, an increase in international trade represents an increase in transport demand. The end-of-year season of Black Friday through Christmas seems to be the peak seasons for both import markets. Considering the maritime transport lead time (1-2 months), that means late summer would usually see a container shipping demand surge. For this year, with the container shipping market already in fever, a 'super peak' season in the coming months is expected and freight rate records getting broken again would not be surprising.
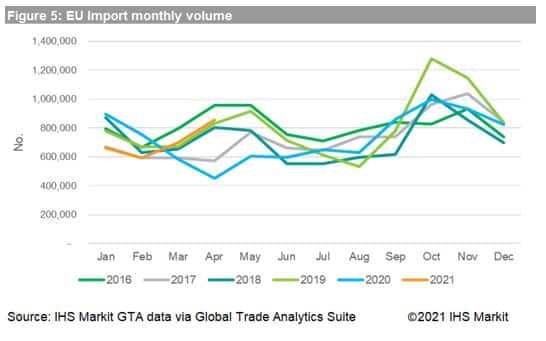
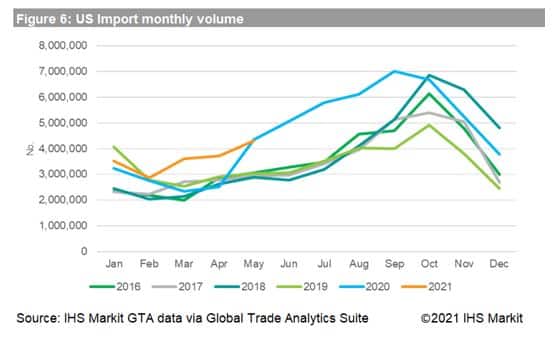
In hindsight the import seasonality of television shows in 2020 represented a 'new normal' too. While US import started to surge since May (when lockdown measures taking place); EU, conversely is experiencing lowest two months, before bounce-back.
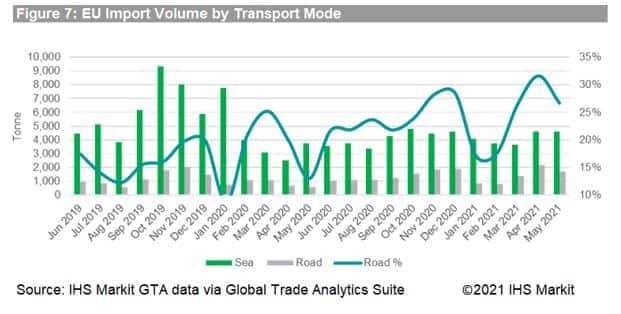
Looking at the transport mode breakdown for EU, it is interesting to see the 'diverging' point of 'bounce back' is marked by the pick-up of road mode share in total volume and the trend kept upward since then.
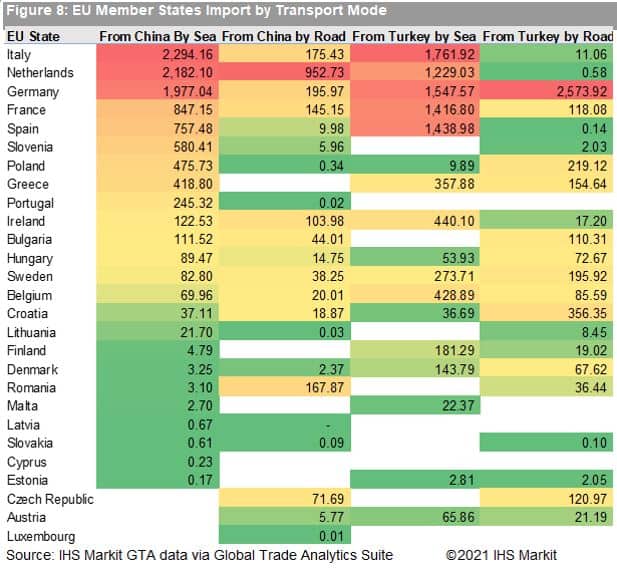
Set out from transport mode, we analyse EU's import from Turkey and mainland China into individual EU member states and look in the two major modes: sea and road. The shipments from the Far East are arriving in EU via sea freight, with Italy, Netherlands and Germany being the top three countries in terms of sea mode import from mainland China. This is not surprising as the three countries all host large container ports on Eurasia marine trade routes; Germany appears to be the predominant land import market from Turkey - implying a landside trade corridor.
Unit Price Concern
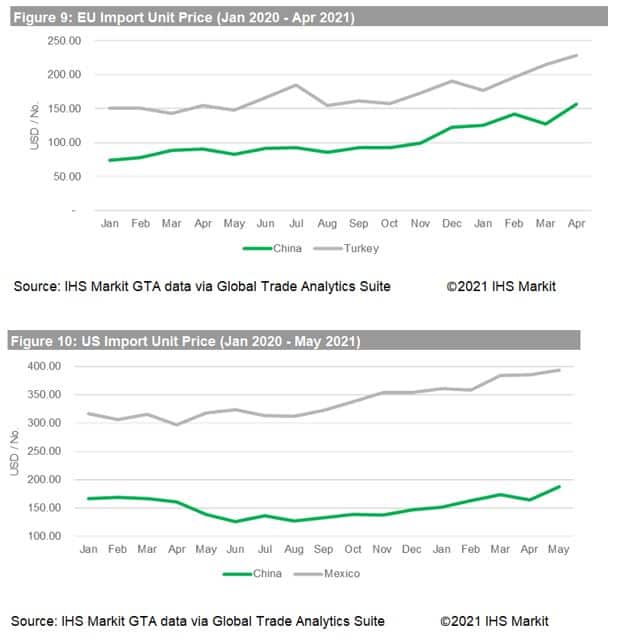
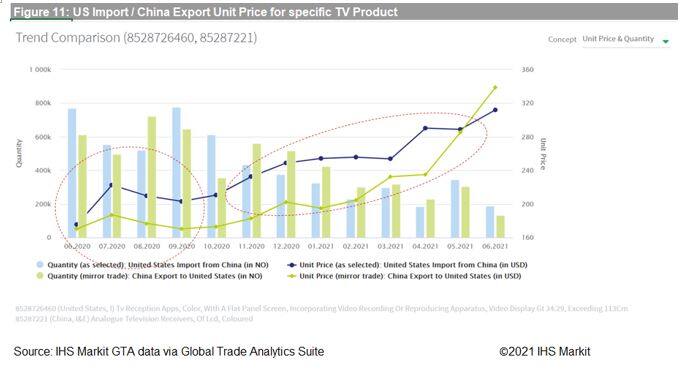
As pointed out earlier, unit price is another factor driving the trade value. In general, the television product trade unit price is arising for both markets since last year, either looking at EU and US import or the mirror trade (at FOB price) reported by major trade partners, i.e. mainland China, Mexico and Turkey.
For example, EU import unit price from mainland China and Turkey stood at USD 90.79 and USD 154.56 in Apr 2020, and this year, it has climbed to USD 156.51 and USD 228.89; and seems the upward curve since last year shows unidirectionality. Likewise for US, average unit price in May 2021 for import from mainland China (USD 186.9/No) and Mexico (USD 393.79) is up 35% and 23% YoY.
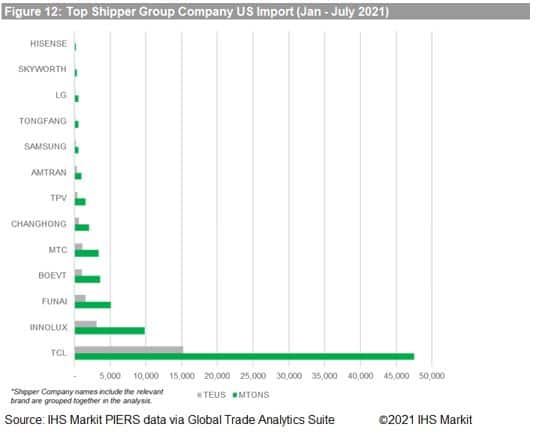
It seems the increase rates are higher for those import from mainland China. Considering the recent uptake of freight, and value reporting trade term (CIF for import vs. FOB for export for most reporters, and both FOB price in the case of Mexico), it would be interested to see if freight already affected import price. In below figure, we may notice that the 'difference' between US import and mainland China export unit price for a particular television product (HS 8528726460 for US) is widened which could possibly be a sign of transport cost. The in-tandem upward straight unit price from both markets could imply a general increase in the product prices, and potentially the involved cost.
It is worth following the unit price dynamics as a reference for wider cost implications, and the variance for mirror trade as a reference for freight cost, especially when the annual freight contract negotiation process starts.
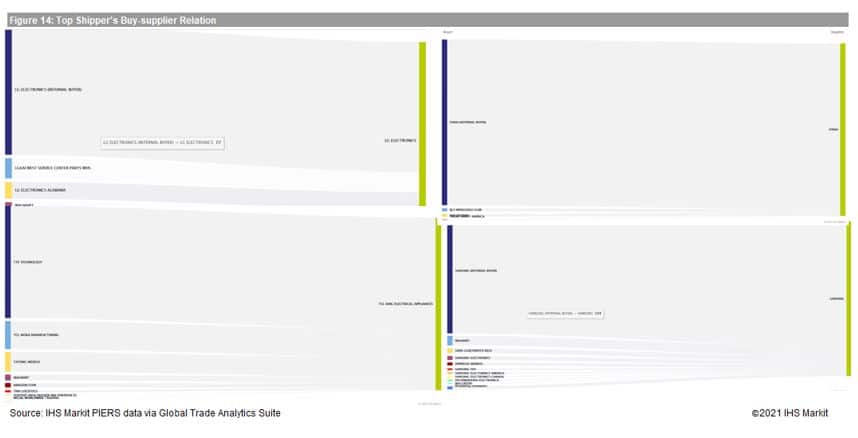
Company Watch
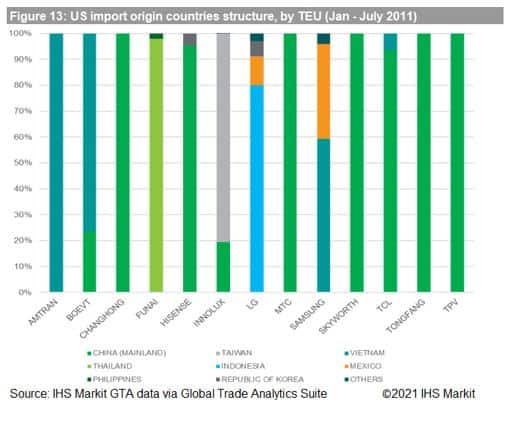
Multinational companies' supply chains are driving global trade though their production and distribution networks. Through the sports games and ad boards on pitch, some television brands sponsoring these events are now familiar to us. Unsurprisingly, these are among the top shippers for US imports of television products, for example TCL, Hisense, Samsung, to name a few. If looking at the origin country of shipment by these companies in the past a few months, we may notice that most of them are having a multi-national presence (i.e., their production sites are located beyond the headquarter office country). And this could make sense when analyzing real and underlying global value chain.
For individual companies, the buy-supplier relations available in the GTAS Company Profile derived from PIERS bill of lading (BOL) data reflects the business activity, for example if the international trade is an intra-company transfer. The giant television companies seems do follow this, as the US consignees end up with the same company's subsidiary are quite common case. A regional 'supply centre' or distribution centre are likely in these cases for inventory holding and planning flexibility.
Relevancy & Implication
Trade statistics provide the key basic data for Trade and Economic researchers to follow the bi-lateral trade at country and regional level. With global reporters' data, these types of analysis would be more holistic and comprehensive. It also supports sectorial and value chain analysis with deep-dive exploration into the underlying complex production network that may involve three or more countries.
More granular data, such as port and transport mode or further final destination-level information are valuable for Logistics and Infrastructure Decisions when comes to setting up regional distribution centres or even any free trade zone / warehouse feasibility study.
MNC Supply Chain and Operations are concerned on planning activities, material and components availability and transport availability, which could be supported by analysing seasonality of demand and monitoring import/export flow and unit price movements. It is also possible to evaluate the market share and any sponsoring / marketing activity effects.
Small and Medium Enterprises may use trade data to understand MNC's production / supply chain structure. MNCs are also buyers of components and raw/packaging materials. Understanding the type of business activities (for example assembly, packaging, or production) carried out by these MNCs will help suppliers, especially SMEs, to participate in their multi-tiered supply chains.
Transactional and macro trade data together may help Company performance assessment from shipment momentum, share in total market or competitions as alternative reference for business activities. In this way, trade activeness and market position may serve as reference to evaluate companies' value and profitability when making investment decisions.
For more details about Global Trade Analytics Suite (GTAS) please visit the product page: https://ihsmarkit.com/products/maritime-global-trade-analytics-suite.html
Subscribe to our monthly newsletter and stay up-to-date with our latest analytics