Featured Topics
Featured Products
Events
S&P Global Offerings
Featured Topics
Featured Products
Events
S&P Global Offerings
Featured Topics
Featured Products
Events
S&P Global Offerings
Featured Topics
Featured Products
Events
Financial and Market intelligence
Fundamental & Alternative Datasets
Government & Defense
Banking & Capital Markets
Economy & Finance
Energy Transition & Sustainability
Technology & Innovation
Podcasts & Newsletters
Financial and Market intelligence
Fundamental & Alternative Datasets
Government & Defense
Banking & Capital Markets
Economy & Finance
Energy Transition & Sustainability
Technology & Innovation
Podcasts & Newsletters
23 Jun, 2016 | 14:00
Highlights
The way companies report their geographic segment financials differ. This post outlines how we can better understand the revenue sources of industries dominated by global players.
The way auto manufacturing companies report their geographic segment financials differs from one company to the next. By choice, companies may report certain financial metrics like revenue and assets by geographic region through their 10K or similar filings outside of the United States. Understanding where the revenue is coming from on a regional, country or currency basis should be easy, but it is actually very challenging. We found this out first hand while comparing and contrasting the sales reported on a geographic basis either for a single country index like the S&P 500® or a global index like the S&P Global 1200.
1. Availability: Not every company chooses to report revenue information by region, but we were able to use business segments, business descriptions, and other reported data to ascertain the proper geographic segment revenue figures for domestic companies, such as auto retailers, O'Reilly Automotive Inc. (NasdaqGS:ORLY) and Sonic Automotive Inc. (NYSE:SAH), that derive 100% of their revenues domestically.
2. Different Names for the Same Region: Not surprisingly, companies use different names to describe the same region. For example: the United States could be listed as The United States, The United States (U.S.), The United States (USA), United States (US) and Other, and many more permutations. We went through the data, standardized all of the naming conventions, and mapped it using information from regional, country or currency reporting whenever possible, and some trial and error, too. This is an ongoing process. 3. Many Ways to Identify the “Other” Region: Grouping revenue from multiple sources in an “other” category can be a catch-all for many companies. For example, many of the companies identified “Other” as Foreign, Other (Foreign), Other Areas, Other Asia-Pacific, and multiple other ways. By looking to financial statement footnotes and specific metrics, we were able to map some of these “other” revenue line items to definitive countries, currencies, and regions. We are also investigating using some proprietary algorithms like the S&P Global Market Intelligence’s quick comp to further define them.
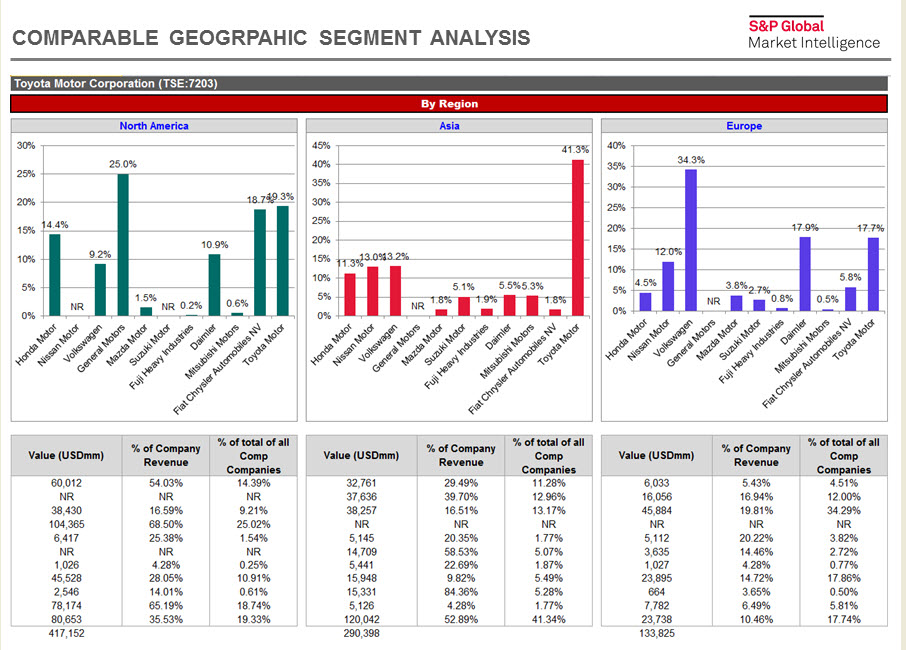
The result of this effort can be used to analyze companies that are global players in certain industries, such as the auto manufacturing industry. Comparing Toyota Motor Corporation’s revenue to its peers on a regional basis, we can perform some interesting apples-to-apples analysis.

For illustrative purposes only.
Using this data, we were able to make three key observations:
With this template, you can view geographic segment data aggregated for an index, portfolio, or watchlist, and analyze region, currency, and country exposure for both growth prospects and risk mitigation. Access this template through the “+New Templates” folder from the “Templates” dropdown within the Excel Plug-in.