Featured Topics
Featured Products
Events
S&P Global Offerings
Featured Topics
Featured Products
Events
S&P Global Offerings
Featured Topics
Featured Products
Events
S&P Global Offerings
Featured Topics
Featured Products
Events
Financial and Market intelligence
Fundamental & Alternative Datasets
Government & Defense
Banking & Capital Markets
Economy & Finance
Energy Transition & Sustainability
Technology & Innovation
Podcasts & Newsletters
Financial and Market intelligence
Fundamental & Alternative Datasets
Government & Defense
Banking & Capital Markets
Economy & Finance
Energy Transition & Sustainability
Technology & Innovation
Podcasts & Newsletters
Research — 22 Aug, 2023
By Jason Wang and Zheng Yulin
S&P Global Market Intelligence tracks and analyzes the risk dynamics in China's credit bond market on a quarterly basis.
Summary of New Bond Issuances in The Market
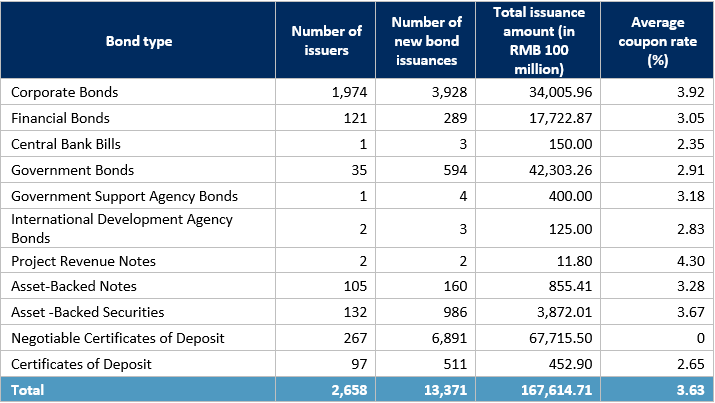
Throughout the second quarter of 2023, China’s credit bond market displayed varying risk characteristics and spread levels across diverse sectors and regions. Table 1 below presents a summary of new bond issuances by type for the second quarter.
Table 1: New Bond Issuances by Type, Q2 2023

Source: S&P China Credit Analytics Platform. Data as of July 3, 2023. For illustrative purposes only.
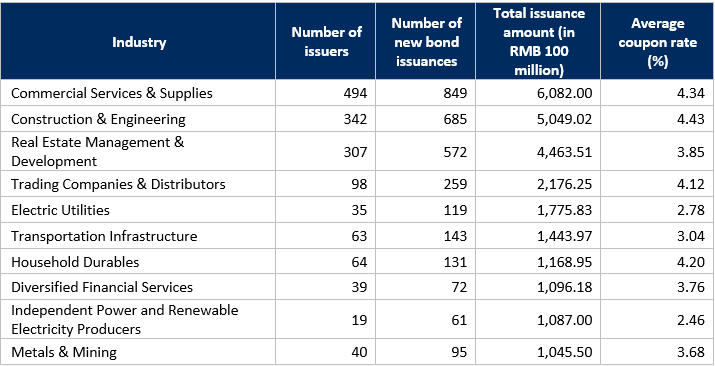
Among all types of bonds, the largest issuances were in corporate and government bonds, totaling RMB3.40 trillion and RMB4.23 trillion, respectively. Furthermore, during the second quarter the coupon rates for newly issued corporate bonds were marginally higher than those for asset-backed securities. The average coupon rate for corporate bonds stood at 3.92%, whereas it was 3.62% for asset-backed securities. Government and financial bonds had relatively low coupon rates, both at approximately 3.0%. The total issuance volume in the market for the second quarter reached RMB16.76 trillion, comprising a total of 13,371 bond issuances. Table 2 below highlights the industries with the most new issuances during the second quarter.
Table 2: Highest Industries for New Issuances in Corporate Bonds, Q2 2023

Source: S&P China Credit Analytics Platform. Data as of July 3, 2023. For illustrative purposes only.
Industries, such as commercial services and supplies and construction and engineering, are the primary sectors for local government financing vehicles (LGFVs). As a result, the new issuance volume of bonds in these industries was notably higher compared to other sectors. Overall, among the industries with higher issuance volumes, the construction and engineering sector, along with commercial services and supplies, stood out with higher coupon rates, both exceeding an average rate of 4.3%. Conversely, industries such as electric utilities and independent power and renewable electricity producers had lower coupon rates, with average rates not surpassing 2.8%. For a detailed breakdown of new bond issuances by industry, please refer to the Appendix included at the end of this report.
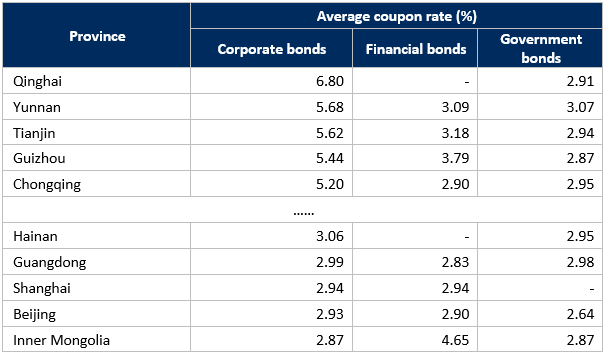
Data was also complied on the total issuance volume and coupon rates of newly issued bonds across different regions. Table 3 below highlights the top five provinces (autonomous regions, municipalities) with the highest and lowest coupon rates for corporate bond issuances.
Table 3: Top Five Provinces with Highest and Lowest Coupon Rates for Corporate Bond Issuances, Q2 2003

Source: S&P China Credit Analytics Platform. Data as of July 3, 2023. For illustrative purposes only.
For a detailed breakdown of new bond issuances by region, please refer to the Appendix included at the end of this report.
Industry Spreads
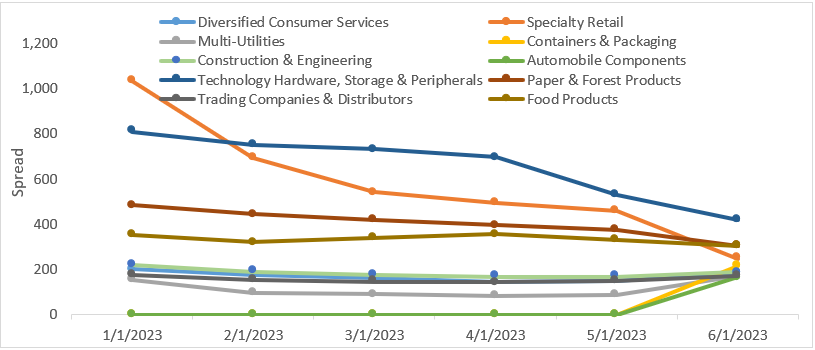
As of the end of the second quarter of 2023, based on the analysis of industry spreads, the average spread level in the overall market was 122 basis points (bps). Among the sub-industries, the top 10 industries with the largest spreads are shown below in Figure 1.
Figure 1: Top Ten Industries with Largest Spreads by End of Q2 2023

Source: S&P China Credit Analytics Platform. Data as of July 3, 2023. For illustrative purposes only.
Report