Featured Topics
Featured Products
Events
S&P Global Offerings
Featured Topics
Featured Products
Events
S&P Global Offerings
Featured Topics
Featured Products
Events
S&P Global Offerings
Featured Topics
Featured Products
Events
Financial and Market intelligence
Fundamental & Alternative Datasets
Government & Defense
Banking & Capital Markets
Economy & Finance
Energy Transition & Sustainability
Technology & Innovation
Podcasts & Newsletters
Financial and Market intelligence
Fundamental & Alternative Datasets
Government & Defense
Banking & Capital Markets
Economy & Finance
Energy Transition & Sustainability
Technology & Innovation
Podcasts & Newsletters
6 Apr, 2017 | 10:00
Highlights
Leverages S&P Global Market Intelligence’s industry-specific intelligence to better understand the impact of department store closures on real estate investment trusts REITs.
As real estate became its own Global Industry Classification Standard (GICS) sector last year, many equity analysts and portfolio managers turned their focus to it. In this report, we leverage S&P Global Market Intelligence’s industry-specific intelligence to better understand the impact of department store closures on real estate investment trusts (REITs). This industry-specific intelligence includes the SNL Real Estate database, which identified 501 global REITs with an average discount to analyst net asset value (NAV) of 3% and potential upside to analysts’ price targets of 9% (Source: S&P Global Market Intelligence, 2016, "Batting for Returns in the REITs Industry"). We take the view of a fundamental analyst looking to research a REIT to identify an asset which may be mispriced compared to the average of that universe.
Challenges when approaching REIT fundamental analysis include:
To illustrate some of the analytical processes that some specialist fundamental analysts follow, we have replicated some of what we believe are the typical steps focusing on CBL & Associates Properties (CBL), one REIT trading at a 53% discount to analyst NAV and 24% discount to target price.
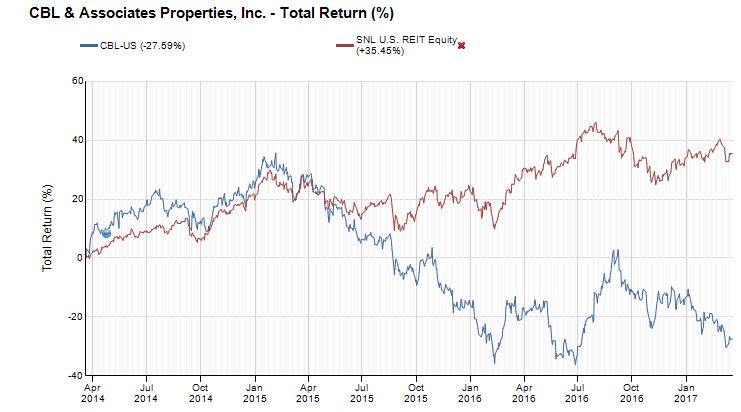
CBL, operating in the USA is a class b1 mall operator. Chart 1 shows that while the valuation is attractive, it also reflects the share price correction over the past two years.
Chart 1: Share price of CBL

Source: SNL Real Estate database as of 21 March, 2017. For illustrative purposes only.
One possible reason for the market's negative assessment of CBL could be identified by looking at its anchor tenants. Department stores such as Macy’s, Sears or J.C.Penney have experienced several quarters of lackluster (if not negative) same-store sales growth. These three department stores have announced nearly 400 store closures in the past six months alone - 2017 has been a brutal year for some retail names. (Source: S&P Capital IQ platform, 2017).
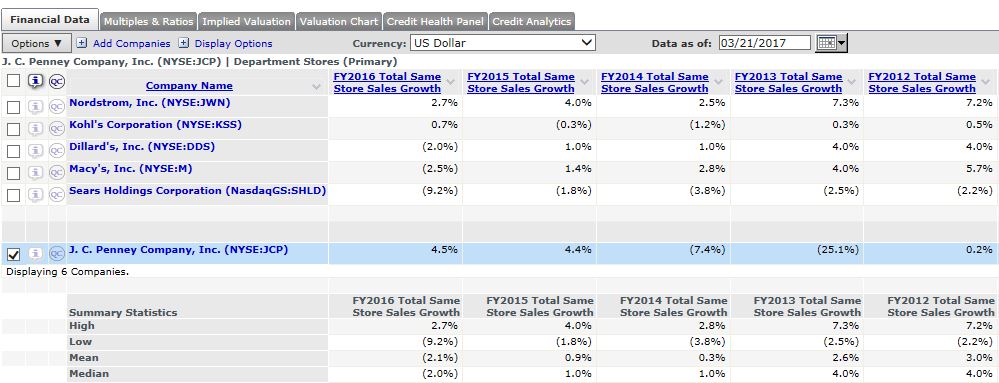
Using S&P Capital IQ platform industry-specific data for J.C. Penney in Table 1, we can track its slow recovery from the precipitous sales decline of 2012, when a strategy shift produced a collapse in same store sales growth (-25.1%). This was in comparison to the remainder of the department store industry that had a relatively quiet year.
Table 1: Industry-specific data snapshot of J.C. Penney for full year (FY) 2012 - FY2016

Source: S&P Capital IQ platform as of 21 March, 2017. For illustrative purposes only.
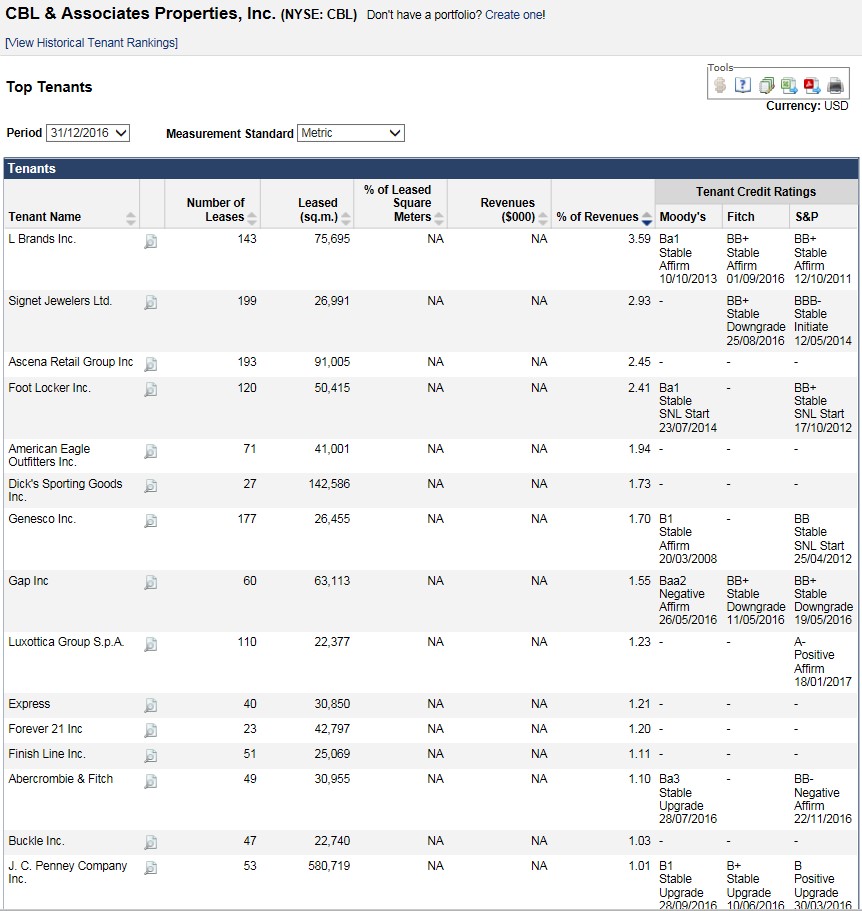
From the REIT asset level data information from the SNL Real Estate database shown in Table 2, J.C. Penney makes up only 1.01% of CBL’s revenues from 53 leases. We note the presence of other large tenants that have struggled to grow sales organically in recent quarters such as Ascena (193 leases for 2.45% of rents) or The Gap (60 leases for 1.55% of rents).
Table 2: Top tenants of CBL by revenues snapshot as of 31 December, 2016

Source: SNL Real Estate database and S&P Capital IQ platform as of 21 March, 2017. For illustrative purposes only.
As seen in Table 2, whilst CBL appears immune to J.C. Penney’s announced store closures, an anchor leaving could still affect its bottom line due to the knock-on effect on smaller retailers in its portfolio. It is common practice for mall operators to segment their floor space. Anchor tenants such as J.C.Penney attract significant footfall, which is appealing to such smaller retailers. As a result, mall operators rent out large floor spaces at a lower price per square meter to anchor tenants and charge higher rents per square meter to other smaller retailers, in particular those who are adjacent and benefit from the presence of the anchor tenant.
Adjacent retailers tend to protect their higher cost rental agreements with get-out clauses so they can terminate their contract or get a price decrease should the anchor leave the mall. If the anchor were to leave, the smaller retailers may follow suit and invoke their get-out clauses.
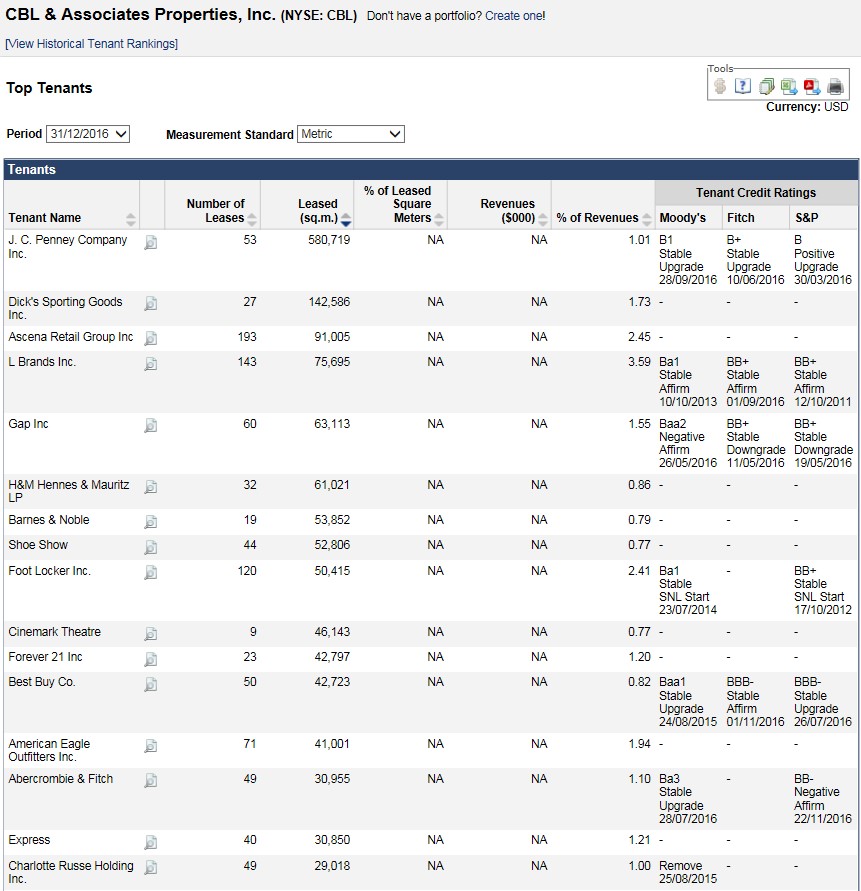
If we consider the floor space rented out by J.C. Penney in Table 3 below above, the company has a rent-per-square-meter markedly lower than most other retailers. Whilst womenswear retailer Charlotte Russe occupies 5% of the space, it generates roughly the same rents as J.C. Penney does.
Table 3: CBL’s top tenants by leased space snapshot as of 31 December, 2016

Source: SNL Real Estate database as of 21 March, 2017. For illustrative purposes only.
This implies that some store closures from this anchor tenant could have a greater impact on adjacent tenants. Depending on other factors such as mall competition or demographics replacing the anchor can be a threat and an opportunity.
Leveraging the SNL Real Estate database, we can track property level information such as anchors, occupancy property valuation or local demographics. We use the example below to identify the kind of competitive threats faced by CBL.
Eastland Mall is located in Bloomington, Illinois and is well positioned at the intersection of major roads. It represents 1.1% of the total floor space owned by CBL. It has five anchors today but is facing a double anchor closure with both Macy’s (Source: S&P Global Market Intelligence News, 2017, Macy’s IDs 68 store closures in streamlining effort) and J.C.Penney (Source: J.C. Penney, 2017, List of Upcoming Store Closures) announcing store closures. This mall had been nearly full with an occupancy ratio above 96% over the past 5 years, whilst CBL itself reported an average 94.8% occupancy across its properties at FY2016.
Table 4: Snapshot of property financials

Source: SNL Real Estate database as of 21 March, 2017. For illustrative purposes only.
Looking at the demographic information for Bloomington, a few positive attributes appear to be the reason for its high occupancy rates and provide the context for a possible anchor tenant replacement:
Table 5: Snapshot of demographics information

Source: SNL Real Estate database as of 21 March, 2017. For illustrative purposes only.
The population density in Bloomington may be helpful for securing new anchors quickly and could help avoid long rental voids. On the flip side it is situated in an area that underperforms the national and state average economically, which may make potential new anchors reluctant to move in.
In conclusion, high profile anchor tenant departures are an area of concern when evaluating REITs and the uncertainty surrounding the likelihood of a successful replacement could impact market valuation. Key factors when assessing the outlook for the property portfolio include:
The illustrative examples in this post have leveraged detailed demographic, economic and asset level data from S&P Global Market Intelligence, within one of the properties for the CBL REIT and its relevance in the detailed fundamental analysis that many REIT analysts perform on day-to-day basis to get a clearer picture of the current and future quality of the assets.
Will department store closures affect your REIT? Find out here.
1 A mall’s classification as either a, b, c or d depends on several factors such as its sales-per-square-foot the tenants generate. Better located malls in more affluent areas will more likely be class a malls.