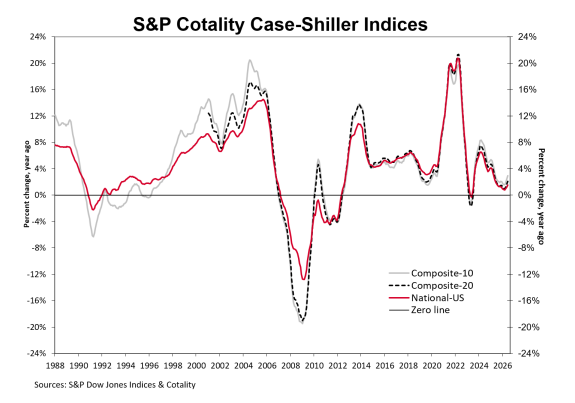
- The S&P Cotality Case-Shiller U.S. National Home Price NSA Index posted a 1.5% annual gain for June 2026, up from a 1.2% rise in the previous month.
- For the 13th consecutive month, U.S. home values fell in real terms, as June’s 3.5% inflation ran roughly 2 percentage points above the 1.5% home price gain.
- A nearly nine percentage point gap separated June’s strongest market (Chicago +6.9% YoY) and its weakest (Seattle -2.0% YoY), underscoring a stark regional divergence in home price trends.
NEW YORK, AUGUST 25, 2026: S&P Dow Jones Indices (S&P DJI) today released the June 2026 results for the S&P Cotality Case-Shiller Indices.
More than 27 years of history are available for the data series and can be accessed in full by going to www.spglobal.com/spdji/en/index-family/indicators/sp-Cotality-case-shiller.
Cotality continues to have transaction delays from the recording office in Wayne County, the most populous county in the Detroit metro area. These delays impacted the June transaction data and, therefore, no valid June 2026 update of the Detroit S&P Cotality Case-Shiller Index will be provided for the August 25, 2026, release date. There was, however, enough data to calculate a valid May 2026 update, which is provided in Tables 2 and 3.
S&P DJI will continue to provide updates to the Detroit index values for the month(s) with missing sale transactions data.
ANALYSIS
“Homeowners and renters alike breathed a sigh of relief in June as inflation cooled to 3.5%, while the S&P Cotality Case-Shiller National Home Price Index posted a 1.5% annual gain, up from a 1.2% annual gain in May,” said Rebecca Kaufman, Associate Director of Commodities at S&P Dow Jones Indices. “While home prices continue to decline in real terms, lower inflation and firmer nominal home price growth in June helped slow that pace of erosion.
“For the fourth consecutive month, Chicago led all metros with a 6.9% annual increase in June, followed by New York (4.8%) and Cleveland (4.1%),” Kaufman continued. “Meanwhile, Seattle recorded the largest annual decline at 2.0%, followed by Las Vegas (-1.9%) and Denver (-1.2%). This geographic divide reflects a years-long trend, with housing markets in the Northeast and Midwest regaining strength while many Western and Sunbelt markets soften.
“Seasonal factors continue to support monthly price growth. On a non-seasonally adjusted basis, both the U.S. National Index and the 20-City Composite gained 0.4% month over month in June. After seasonal adjustment, the U.S. National Index and the 20-City Composite gained 0.1% and 0.3% month over month in June, respectively. Because June typically falls near the peak of the homebuying season, price appreciation often moderates and market activity cools in the months ahead.
“The housing market remains under pressure, with 30-year mortgage rates holding near 6.5% in June,” Kaufman concluded. “As financing costs are kept high for prospective buyers, current homeowners remain reluctant to give up the low mortgage rates secured in prior years.”
YEAR-OVER-YEAR
The S&P Cotality Case-Shiller U.S. National Home Price NSA Index, covering all nine U.S. census divisions, reported a 1.5% annual gain for June. The 10-City Composite saw an annual increase of 2.9%, up from a 2.4% increase in the previous month. The 20-City Composite posted a year-over-year increase of 2.1%, up from a 1.6% rise in the previous month.
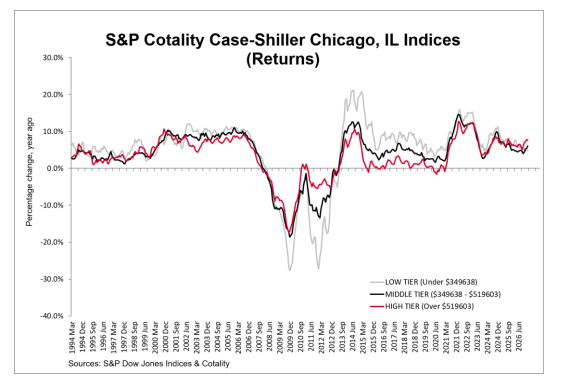
Chicago reported the highest annual gain among the 20 cities with a 6.9% increase in June, followed by New York and Cleveland with annual increases of 4.8% and 4.1%, respectively. Seattle posted the lowest return in June, falling 2.0%. The chart below compares year-over-year returns for different housing price ranges (tiers) in Chicago.
MONTH-OVER-MONTH
The pre-seasonally adjusted U.S. National and 20-City Composite Indices recorded monthly gains of 0.4%, while the 10-City Composite Index posted a 0.5% gain.
After seasonal adjustment, the U.S. National, 10-City, and 20-City Composite Indices posted 0.1%, 0.3%, and 0.2% gains, respectively.
SUPPORTING DATA
The chart below depicts the annual returns of the U.S. National, 10-City Composite, and 20-City Composite Home Price Indices.