In November 2025, S&P Dow Jones Indices (S&P DJI) expanded the S&P Dividend Growers Series with the launch of the S&P Developed Ex-North America Dividend Growers Index. With this addition, the suite now includes high quality dividend growth companies across developed markets outside North America. Consistent with the methodology of the broader series, the index applies rigorous dividend eligibility screens, resulting in a set of high quality dividend growth companies that have historically exhibited defensive characteristics alongside strong absolute and risk-adjusted performance.
1. How does the index work?
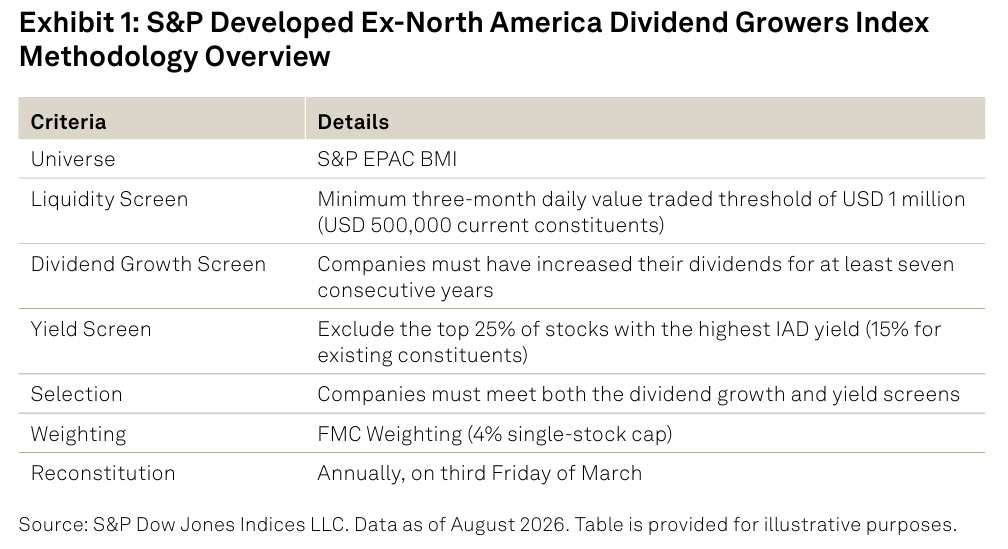
Starting with the S&P EPAC BMI universe, the methodology applies a liquidity screen (minimum three-month average daily value traded of USD 1 million, or USD 500,000 for current constituents), followed by two dividend screens: a seven-year consecutive dividend growth screen and a yield screen excluding the top 25% of companies with the highest indicated annual dividend (IAD) yields. Companies passing these screens are weighted by float-adjusted market capitalization (FMC), subject to a 4% single-stock cap. The index is reconstituted annually on the third Friday of March.
2. How do the two dividend eligibility screens contribute to index quality and guard against "yield traps"?
The two dividend eligibility screens work in tandem to enhance the overall quality of the index from two distinct vantages—dividend growth and dividend yield. The growth screen enhances quality because the ability to reliably grow dividends over the long term can be a strong indicator of high profitability, financial strength and company discipline. The yield screen, meanwhile, helps mitigate the risk of "yield traps," in which high yields often stem from declining share prices rather than sustainable dividend growth. This is supported by our research, which found that the highest-yielding securities have often historically underperformed, with their elevated yields attributable to price declines rather than sustained dividend strength over time.
3. How has the index performed?
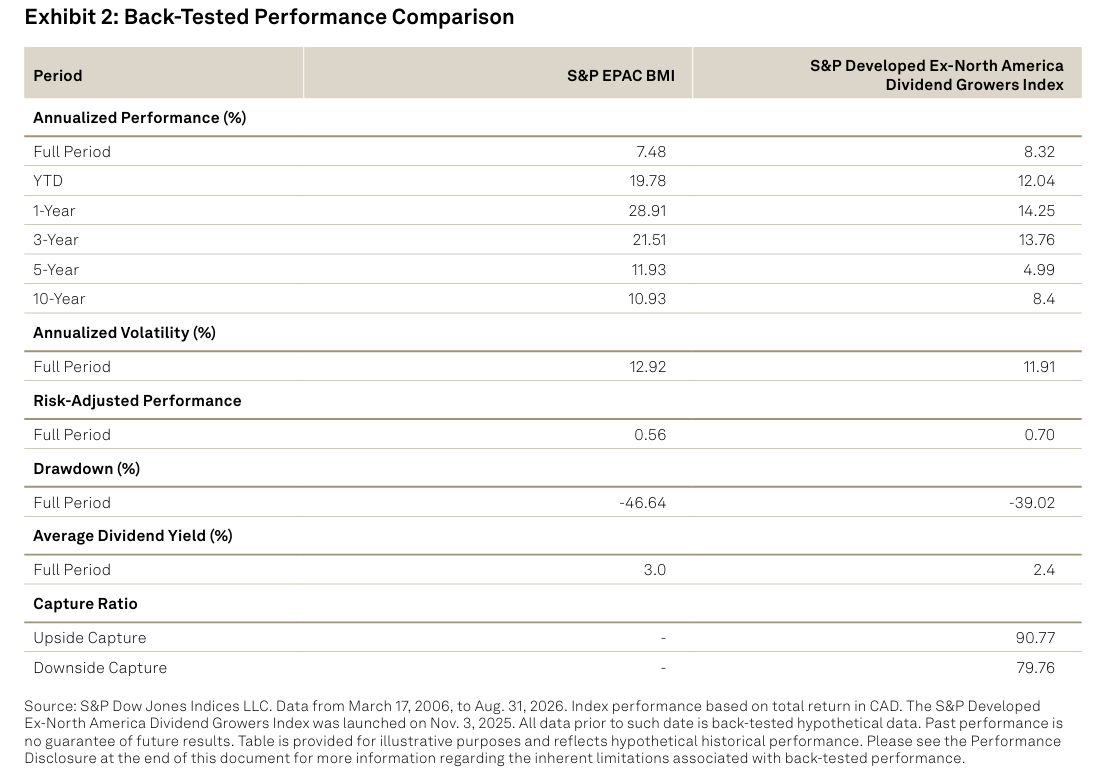
Over the full back-tested period from March 17, 2006, to Aug. 31, 2026, the S&P Developed Ex-North America Dividend Growers Index outperformed the S&P EPAC BMI by approximately 84 bps on an annualized basis. Notably, it achieved this outperformance while demonstrating lower overall volatility, lower capture ratios and smaller maximum drawdowns, resulting in stronger risk-adjusted performance.