


Introduction
Fifteen years ago, the Dow Jones U.S. Dividend 100 Index was launched with a clear objective: to identify high-dividend-yielding companies with a track record of consistent dividend payments and fundamental strength, as measured through a rigorous, multi-dimensional evaluation process. Since its inception, the index has grown into one of the most widely recognized dividend benchmarks in the market, with assets tracking the index exceeding USD 100 billion. 17, 2026.
Its distinctive methodology, built around four fundamental pillars, helps differentiate it from many other dividend-focused indices and has historically been associated with high yields, high dividend growth and strong price performance. To mark this milestone anniversary, we present 15 “fun facts” that showcase the index’s design, performance and story over its first 15 years.
1. The Dow Jones U.S. Dividend 100 Index evaluates high yield companies across multiple dimensions—not just one. Rather than selecting stocks solely on the basis of dividend yield, the index employs a composite scoring methodology to identify the 100 companies that demonstrate the most dividend strength and overall highest financial quality.
The index construction process starts by selecting companies with a track record of consistent dividend payments, excluding any company that has not paid cash dividends for at least 10 consecutive years. A yield screen is then applied, removing the lower half of the remaining constituents based on indicated annual dividend (IAD) yield.
Eligible companies are then ranked using a composite score that combines four fundamental metrics: IAD yield, five-year dividend growth, return on equity (ROE) and the ratio of free cash flow (FCF) to total debt. Unlike many high yield dividend strategies that focus primarily on yield or apply only basic screening criteria, the Dow Jones U.S. Dividend 100 Index places equal emphasis on two dividend-focused metrics (IAD yield and five-year dividend growth) and two quality-oriented metrics (ROE and FCF-to-total-debt ratio). By integrating quality as a core component of the selection process, the index seeks to identify companies that not only offer meaningful yield today but also exhibit characteristics associated with financial strength and dividend growth over time.
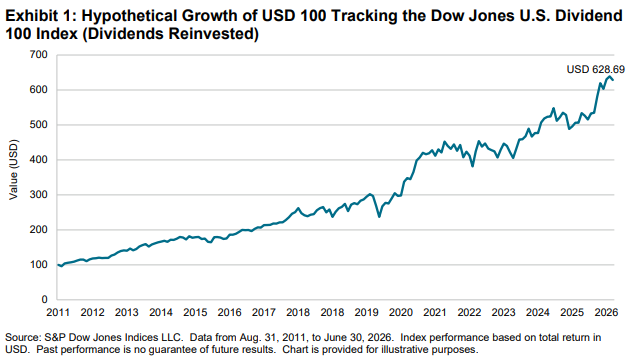
2. USD 100 tracking the index at its inception 15 years ago would have grown to USD 628.69. Assuming dividends were reinvested, a hypothetical USD 100 tracking the Dow Jones U.S. Dividend 100 Index on Aug. 31, 2011, would have grown to USD 628.69 by June 30, 2026 (see Exhibit 1).
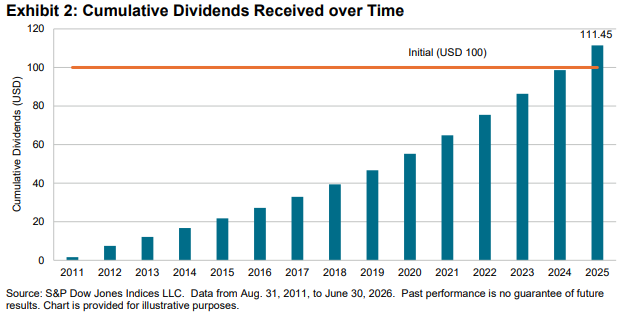
3. USD 100 tracking the index at its inception 15 years ago would have generated more than USD 100 in dividends As outlined in Exhibit 2, had a market participant chosen to receive the dividends rather than reinvest them, they would have accumulated a total of USD 111.45 in dividends by 2025—exceeding the original USD 100.