






































IN THIS LIST

Sector Neutrality - An Essential Mechanism within the S&P 500 ESG Index

Three-Year Live Performance Review of the S&P QVM Top 90% Indices

Fixed Maturity in Focus: Constructing a Ladder for Stability and Yield

A Window on S&P/ASX Index Liquidity

Celebrating 10 Years of the S&P 500 Quality Index

Sector Neutrality - An Essential Mechanism within the S&P 500 ESG Index

Contributor Image
Stephanie Rowton

Senior Director, Tokenization and U.S. Equities

S&P Dow Jones Indices

The S&P 500® ESG Index seeks to provide a measurement of U.S. equities while incorporating ESG factors.1 The index maintains similar industry weights to the S&P 500 while enhancing the index's sustainability characteristics.

The Importance of Sector Neutrality within the S&P 500 ESG Index

A common misconception is that ESG indices remove or underweight sectors deemed environmentally unfriendly such as Energy or Utilities. Rather than excluding sectors, the S&P 500 ESG Index selects companies that perform highest when considering environmental, social and governance metrics, while historically reflecting many of the attributes of the S&P 500. Removing entire sectors may result in a shift in weight toward other sectors—potentially creating sector bias and concentration risk.

Using Information Technology as an example, one constituent was excluded as per the S&P ESG Indices methodology. It then selected constituents from each industry group within Information Technology, starting from constituents with the highest ESG scores, to reach 75% of the underlying index's market cap. From this, 22 constituents were selected, meaning the index included only 33% of the initial stock count from the S&P 500's Information Technology sector. Were the methodology to reallocate additional weight to Information Technology, it could have created concentration risk in the few selected constituents.

Achieving Sector Neutrality

The S&P 500 ESG Indices aim to achieve a broadly sector-neutral outcome by making ESG score exclusions on a relative basis within each GICS® industry group, rather than removing entire industry groups.2 Consequently, the success of the index is not solely measured through its performance, but rather by whether industry group weights (and, by extension, sector weights) remain similar to the S&P 500.

However, excluding companies based on ESG metrics will result in deviation from the underlying index. Some active share is therefore inevitable; while the sector active share is only 6.27%, illustrating broad sector neutrality, the index itself has an active share of 27.54%,3 driven by a disparity in holdings and weights with the S&P 500. The deviation between the S&P 500 ESG Index and the S&P 500 is particularly evident when a sector has several constituents removed or a company with a high float market cap (FMC) is excluded.

When considering Information Technology (see Exhibit 2), it is possible to conclude that active share was likely driven from a few constituents that were included in the S&P 500 ESG Index. Furthermore, Broadcom, with an FMC of 1.35%, was not selected for inclusion (see Exhibit 3). Whereas the removal of Amazon, with an FMC of 3.79%, is a likely driver for the deviation in the Consumer Discretionary sector.

Performance Attribution

Perhaps unsurprisingly, performance attribution primarily reveals the history of constituent selection rather than sector weighting (see Exhibit 4).5 This is partly because the index has historically been successful in maintaining similar sector weights to the S&P 500. An additional outcome of maintaining similar sector weights is the index achieving relatively low tracking error4at 1.39%.6 Interestingly, the S&P 500 ESG Index's performance has consistently benefited from selecting the second-best scoring constituents7 and avoiding the worst ESG-scoring constituents.8

Conclusion

The S&P 500 ESG Index has successfully provided a measurement of U.S. equities with an ESG lens, and has maintained similar industry group weights as the S&P 500. By utilizing index construction to maintain broad sector neutrality, the index has historically reduced the impact of sector-driven performance, increased the impact of stock selection and consequently produced low tracking error versus the S&P 500.


1 See Rowton, Stephanie, Sanchez, Maria, "The S&P 500 ESG Index: 5 Years of Defining Core Through an ESG Lens"

2 See Rowton, Stephanie and Sanchez, Maria, "The S&P 500 ESG Index: 5 Years of Defining Core Through an ESG Lens"

3 Source: Arrow, S&P Global as of June 30, 2024.

4 Please refer to the Exclusions file.

5 See Rowton, Stephanie, Sanchez Maria "The S&P 500 ESG Index: 5 Years of Defining Core Through an ESG Lens"

6 Data as of April 30, 2024, 36-month annualized tracking error.

7 New Frontiers: The S&P 500 ESG Index's Performance Beyond the S&P 500

8 See Beyhan, Maya, "The Key to the S&P 500 ESG Index's Outperformance: Avoiding the "Worst"


Three-Year Live Performance Review of the S&P QVM Top 90% Indices

Contributor Image
Hugo Barrera

Senior Analyst, Factors and Dividends Product Management

S&P Dow Jones Indices

Three years ago, S&P DJI launched the S&P Quality, Value, and Momentum Top 90% Multi-factor Indices (the S&P QVM Top 90% Indices) across the large-, mid- and small-cap U.S. equities segments. These indices have enriched our factor lineup, offering a differentiated approach that selects a high percentage of the universe, while excluding only the lowest-ranked decile.

In this blog, we will recap the methodology, review the indices' performance and dive into their core characteristics.

Methodology Overview

The S&P QVM Top 90% Indices track the stocks in the top 90% of their respective underlying universes, ranked by their multi-factor score, which is based on the average of quality, value and momentum factors. Constituents are float-adjusted market capitalization weighted. This approach aims to ensure that the indices maintain similar stock counts and constituent weights as their benchmarks, which has historically resulted in low tracking error.

To illustrate the rationale behind removing the bottom 10% of stocks by multi-factor score, we can compare the performance of each decile in the S&P 500. In our analysis, we ranked stocks within the large-cap universe by their multi-factor score and rebalanced quarterly, with D1 representing the highest-ranked stocks and D10 the lowest. Exhibit 1 shows that the bottom 10% stocks significantly underperformed the other deciles within the large-cap universe.

Three-Year Live Performance of the S&P QVM Top 90% Indices

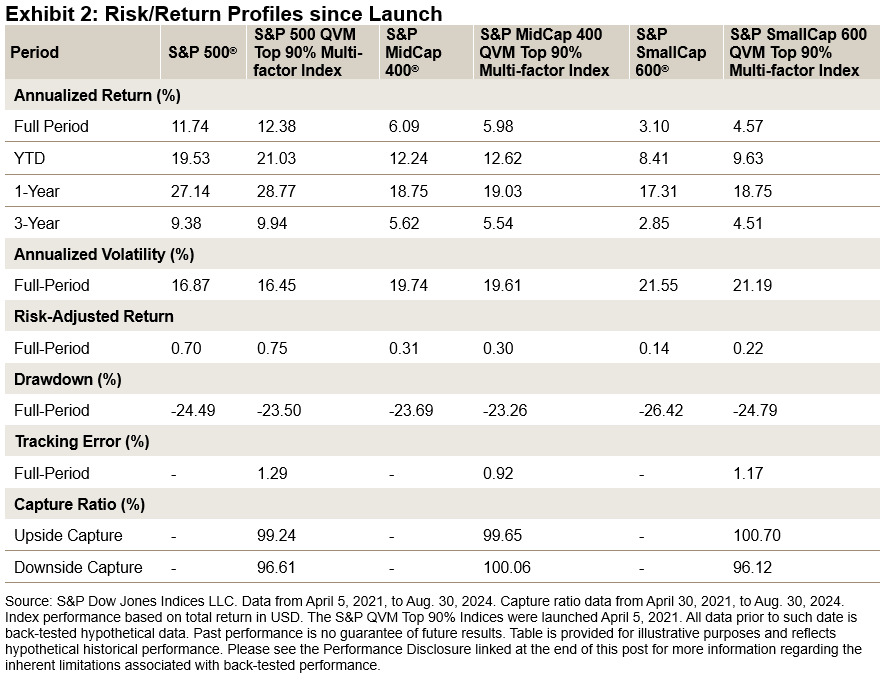
The index construction has historically limited significant outperformance or underperformance relative to the benchmark. Exhibit 2 demonstrates that since their launch, the S&P QVM Top 90% Indices have moderately outperformed their benchmarks in both the large- and small-cap universes. In the mid-cap universe, the S&P QVM Top 90% Index has generally performed in line with its benchmark. Year-to-date, all three of the S&P QVM Top 90% Indices have outperformed their benchmarks.

The methodology of the S&P QVM Top 90% Indices has helped maintain a low tracking error, reduce volatility and lower maximum drawdowns since their launch. The similar capture ratios further demonstrate that the methodology has reduced large deviations compared to the benchmark during up and down markets.

Back-Tested Performance of the S&P QVM Top 90% Indices

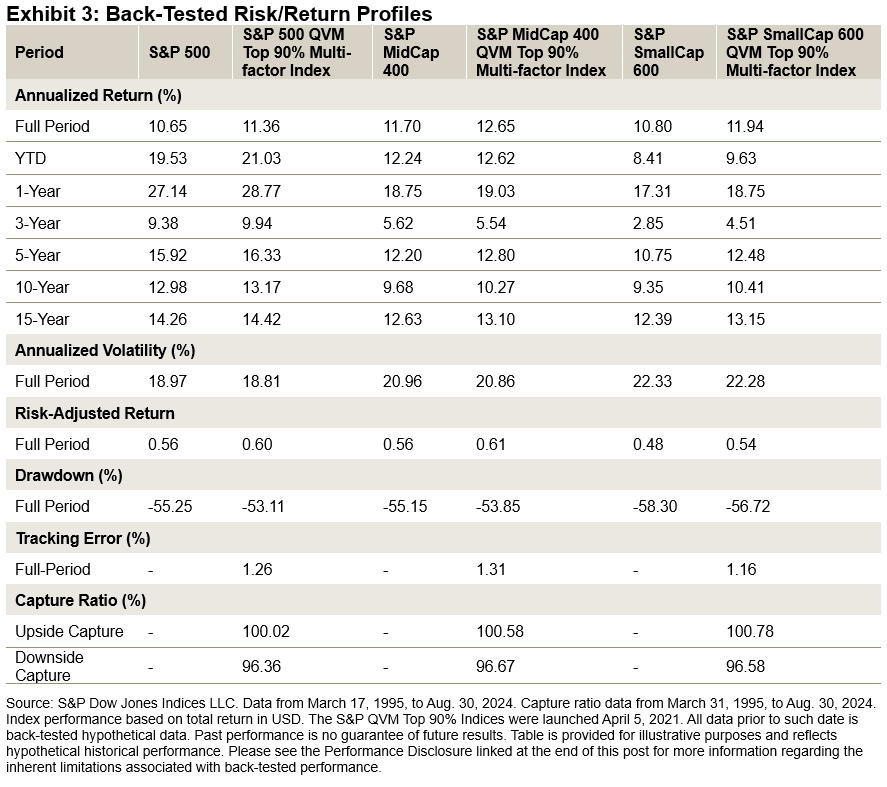
As shown in Exhibit 3, all three S&P QVM Top 90% Indices have outperformed their benchmarks over the long term, both in absolute and risk-adjusted terms, while maintaining a low tracking error. Additionally, over the long-term period, they have provided lower volatility and lower maximum drawdown.

Conclusion

Overall, the S&P QVM Top 90% Indices have consistently demonstrated the ability to outperform over the long and short term, all while maintaining low tracking errors and benchmark-like features such as similar stock counts and constituent weights.

These indices have shown their potential to provide moderate outperformance, reduced risk of underperformance and low tracking errors, all while preserving similar characteristics to their benchmarks.


Fixed Maturity in Focus: Constructing a Ladder for Stability and Yield

As fixed income index solutions continue to evolve, one notable innovation has been that of fixed maturity indices. Fixed maturity indices have existed in the U.S. for over 10 years, where growth and adoption have increased over that time. The market is newer in Europe, where adoption has taken shape over the last 12 months. As this market expands across geographies and exposures, we take a closer look at the construct and the utilization of the fixed maturity index.

What is a fixed maturity index? How is it different from a typical broad-based fixed income index?

A fixed maturity index is an index that holds bonds that expire within the same maturity year or period. For example, the iBoxx® USD Corporates 2029 Index holds only investment grade bonds that mature in the year 2029. It draws on the same broad-based, diversified investment grade corporate universe that represents the beta of the market, but filters for a specified year of maturity. In 2029, the final year of the index, maturing bond proceeds are invested into money market instruments rather than investment grade bonds at rebalance; by the end of the expiration year, the index will have converted to an index of money market instruments and subsequently expire. In this way, one might refer to a fixed maturity index as having a maturity year (in this case, 2029), drawing a contrast to the typical construct of a fixed income index (which is perpetual in nature), as maturing proceeds are typically reinvested into the underlying securities and the original asset class exposure is constantly maintained.

Why is it interesting that a fixed income index "matures"?

The maturing nature of a fixed maturity index draws similarities to the profile of an individual bond, which has a maturity year where one may expect a return of principal. A scheduled maturity that is known in advance may be useful in financial planning where the timing of cash flow needs is certain. In the case of a fixed maturity index, one has certainty on a "maturity" year, but the exposure is not just one bond, it is an index of bonds. So, a fixed maturity index provides investors with a maturity date while still allowing diversification benefits of a broad-based fixed income benchmark. Fixed maturity indices are typically established with multiple maturity years, e.g. iBoxx USD Corporates Fixed Maturity Indices span the years 2027-2035.

How are fixed maturity indices utilized? What is a bond ladder?

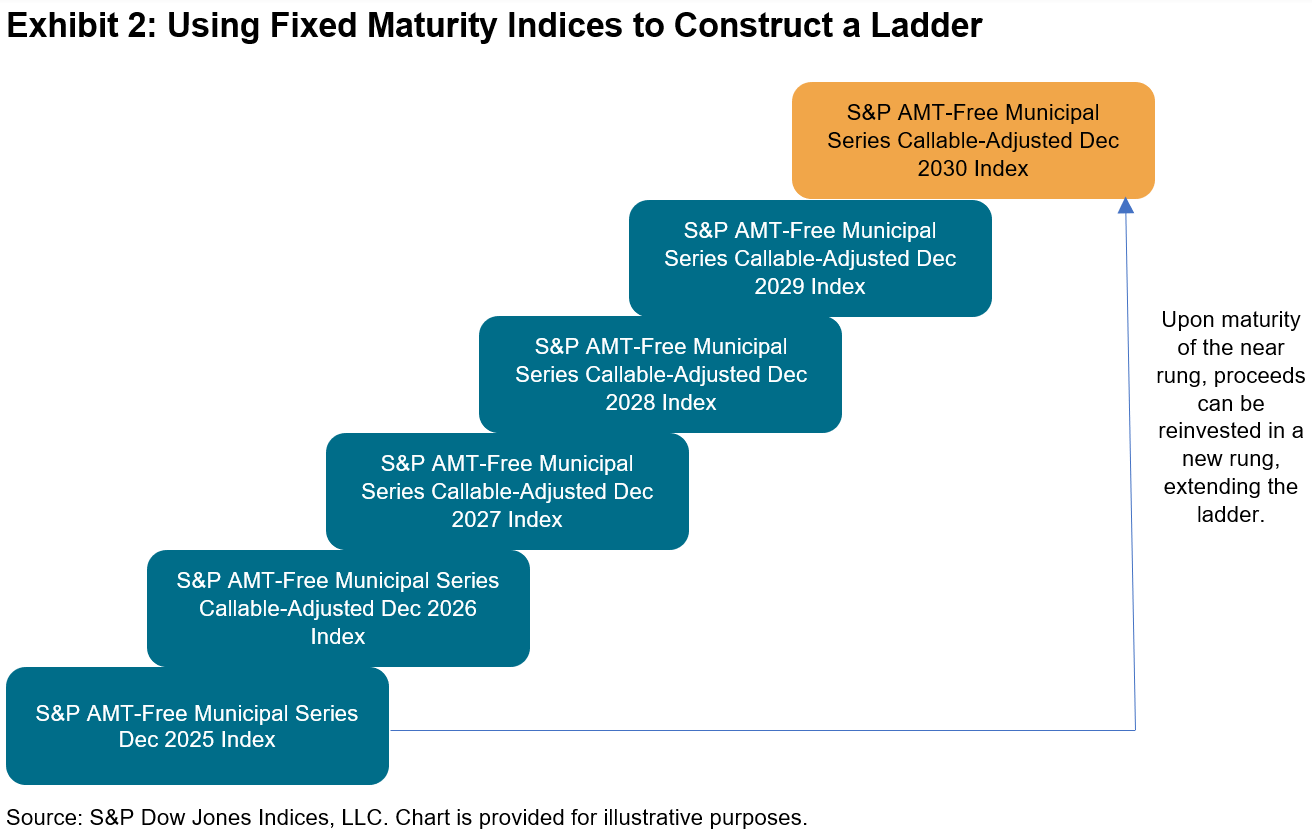
Bond laddering is a commonly used framework that has always existed in the investment community for individual bonds, and it now may utilize fixed maturity indices in a similar application. A bond ladder is constructed by choosing maturity years that match the needs of the investor. As a rung on the ladder matures, the proceeds may be extended to a further rung of the ladder. The resulting "ladder" of bonds is a construct that is meant to provide current income in the form of coupons while smoothing out interest rate fluctuations, as the staggered maturity dates track different yields.

Bond versus Bond Index

Bond ladder rungs were originally designed using single fixed income securities. By constructing a ladder using fixed maturity indices relative to individual securities, there could be potential diversification benefits and potentially minimized transaction costs as individual bonds may be difficult to access. This contrast has contributed to the growing popularity of fixed maturity indices and has resulted in index solutions being developed across all segments of fixed income, including investment grade credit, high yield credit, municipal bonds and sovereigns. For example, S&P DJI has carried a U.S. Municipal Bond Fixed Maturity Suite for over a decade and was one of the early adopters of this index construct as practitioners began utilizing indices to construct bond ladders. Our suite, the S&P AMT-Free Municipal Bond Index Series, first launched 15 years ago, includes indices with consecutive maturity years from 2024 to 2030. The recent expansion in Europe has spanned corporate credit and sovereigns, for all of which S&P DJI has index capabilities.


A Window on S&P/ASX Index Liquidity

Contributor Image
Sue Lee

APAC Head of Index Investment Strategy

S&P Dow Jones Indices

Over the years, the accumulation of assets and trading volumes across index-linked products such as futures, options and exchange-traded funds (ETFs) has led to a trading ecosystem associated with major market indices. Index arbitrageurs and market makers trade different products tracking the same index, keeping their prices sufficiently close to the underlying index. Other market participants use these products interchangeably to obtain or adjust their exposure. All these trading activities support pricing and liquidity, fostering market efficiency and transparency.

A robust index trading ecosystem benefits frequent traders by allowing them to trade related index-linked products with relatively lower cost, including bid-ask spread and market impact, and in relatively larger size. Long-term passive investors also benefit from an assurance in the value of their investment throughout their investment horizon; investors enter the trade at a price close to fair value, monitor the value of their holding in real time, and may have reasonable confidence to exit at near fair value.

Among the tradeable indices produced by S&P Dow Jones Indices, the S&P/ASX Index Series has the third-largest trading volume, after the S&P 500® and the Dow Jones Industrial Average®. Its aggregate traded economic value1 in 2023 exceeded USD 1.9 trillion, largely driven by the futures contracts of the S&P/ASX 200, a preeminent Australian benchmark index (see Exhibit 1). Its total indexed assets were estimated at USD 102 billion at the end of 2023.2 Since its debut in 2000, the S&P/ASX Index Series has served as the barometer of the Australian stock market and become an integral part of the country's market infrastructure.

Australian ETFs are a good example of the benefits of an index trading ecosystem. Exhibit 2 shows the historical turnover and assets under management (AUM) of the five largest Australian domestic equity ETFs listed on the ASX. Fund AUM and turnover display a positive relationship in general, with the ETFs tracking the S&P/ASX 300 having the highest AUM and turnover most of the time. More interestingly, given a similar level of fund AUM, ETFs tracking the S&P/ASX 200 tended to have higher turnover than the three ETFs tracking other indices.

Higher trading volumes often contribute to lower trading costs, which is shown in the historical bid-ask spread levels of these ETFs in Exhibit 3. While the S&P/ASX 300 ETF usually had the tightest spreads, ETFs in all three categories traded in a stable bid-ask spread range of 3-5 bps since 2023. March 2020 to May 2020 stands out as an exception—when market volatility spiked along with turnover, the S&P/ASX 200 ETFs maintained notably lower bid-ask spreads than ETFs in the other two categories. The benefit of a large and active trading ecosystem comes to the fore when market moves amplify and the need for trading increases.

A recent episode on Aug. 5, 2024 reminded us of this again, as the S&P/ASX 200 ETF bid-ask spread remained most stable during a day characterized by a 3.7% market sell-off and the S&P/ASX 200 VIX soaring from 12 to 19. Both issuers and users of index-based products may want to consider underlying index liquidity when designing or choosing a product.

1 Traded economic value is measured by Index Equivalent Trading Volume, a notion developed by S&P Dow Jones Indices to reflect the economic exposure to the index that is being transacted at the time a trade occurs. It is determined by the instrument's short-term responsiveness to movements in the underlying index (i.e., adjusted by the delta of the instrument). For details, please see Edwards, Tim, "A Window on Index Liquidity: Volumes Linked to S&P DJI Indices," S&P Dow Jones Indices LLC, August 2019.

2 Indexed assets are assets in and/or notional value of institutional funds, ETFs, retail mutual funds, exchange-traded derivatives and other investable products that seek to replicate or capture the performance of the S&P/ASX Index Series. See Annual Survey of Assets as of December 31, 2023, S&P Dow Jones Indices LLC.


Celebrating 10 Years of the S&P 500 Quality Index

Contributor Image
George Valantasis

Director, Factors and Dividends

S&P Dow Jones Indices

Launched on July 8, 2014, the S&P 500® Quality Index established a framework for identifying high quality companies within the S&P 500. Today, it celebrates a decade of existence as one of the most prominent indices within our factor family. Over the past decade, quality has emerged as a mainstream factor, with significant growth in assets that track the factor. In this blog, we will review the performance of the S&P 500 Quality Index, analyze changes in sector weight and explore the quality characteristics since its inception.

10-Year Performance Review

For the 10-year period ending July 31, 2024, the S&P 500 generated a historically strong 13.14% annualized return (see Exhibit 1). Perhaps even more remarkable, however, is the S&P 500 Quality Index's 13.28% annualized return, considering its defensive attributes that generally result in lower volatility.

Exhibit 2 displays the annual returns of the S&P 500 and S&P 500 Quality Index since its launch in July 2014. Notably, there have been minimal differences in annual returns over the past decade. However, a significant deviation occurred in the first seven months of this year, with the S&P 500 Quality Index outperforming the S&P 500 by approximately 3.69%.

Sector Weight

Exhibits 3 and 4 display the sector weights of the S&P 500 Quality Index since its inception. Exhibit 3 shows that the sector weights have been consistent. Information Technology had the highest average sector weight at 31.6%, as well as the largest overweight compared to the S&P 500, with a difference of 7.3%. Financials held the largest underweight relative to the S&P 500 at 5.6%, although it still had an average weight of 7.7% over the 10-year period.

Quality Metric Comparison: Then versus Now

Exhibits 5 and 6 showcase the improved return on equity (ROE) and net income margin of the median constituent of the S&P 500 Quality Index over the last 10 years. The S&P 500 Quality Index's median constituent increased its ROE from 24.8% to 33.5%, representing a 35% improvement. In comparison, the S&P 500's median constituent saw a more modest increase in ROE, from 14.5% to 16.6%, representing a 14% improvement. A similar trend is observed in the improvement of net income margin, with the median constituent in the S&P 500 Quality Index improving by 33%, versus 19% for the S&P 500.

Conclusion

Overall, the S&P 500 Quality Index may have exceeded expectations during the predominantly bullish market conditions of the past decade. The index delivered on expectations of providing defensive characteristics in the form of lower volatility and downside capture. Moreover, it achieved this outperformance without substantial sector differences compared to the S&P 500. Not to mention, the strategy's quality profile improved over this period as well.