


28 Apr 2017 | 05:31 UTC — Insight Blog
Why a tightening US natural gas system could put the squeeze on LNG

By Gary Hornby
Europe is banking on cheap US LNG exports competing with Russian pipeline natural gas to keep prices low and global supplies plentiful. But the US natural gas system is not as comfortable as you might think.
The US produced less gas in 2016 than in 2015, the first time since 2005 that gas output fell from one year to the next. At the same time demand for US natural gas is rising –- mainly in the power generation sector, but also for pipeline exports to Mexico and LNG exports.
Both domestic end-user demand in local distribution zones (LDZ) and power generation demand are highly weather sensitive, meaning a particularly hot summer or cold winter could create severe regional imbalances in the US gas system, if not a national imbalance.
This would put the US benchmark Henry Hub natural gas price on an upward trend unless domestic output recovers. This has implications for the global gas markets, as Henry Hub is expected to set the floor price for US LNG exports, and therefore the floor for natural gas prices in Europe and Asia.
The new Republican administration is attempting to remove regulatory barriers to oil and gas production within the US, which should support output in the medium-term.
However, if President Donald Trump delivers on his promises of boosting US manufacturing, or engineers a steer away from renewables in the generation mix, both the industrial and power generation sectors could deliver an additional boost to gas demand.
Higher Henry Hub prices would not necessarily reduce US LNG exports, as Cheniere Energy has already contracted significant volumes from its Sabine Pass LNG terminal to several large global LNG players, such as Shell and Centrica.
Volumes taken by Sabine Pass from the US gas system are expected to increase sharply this year as Trains 1 and 2 run at full capacity and a third train comes online, and more LNG export terminals are planned online by 2020.
These include Cove Point, southeast of Washington DC, which is due to bring on its single LNG train toward end-2017. Corpus Christi is scheduled to begin service in 2018, the three-train Cameron plant in 2018, while Freeport should have two trains operating in 2018, with a third following in 2020.
Cheniere also plans to bring on three more LNG trains at Sabine Pass by the end of this decade.
If all planned US LNG terminals come online within their estimated time frames, they could create as much as 105 Bcm of additional annual gas demand by 2020. This is around 13% of the total 810 Bcm of gas consumed in the US in 2016.
Can the US gas system cope?
Much confidence has been placed in the prolific output of US gas. Several years ago, forecasts for production showed steady year-on-year increases throughout the 2010s on the back of the shale revolution.
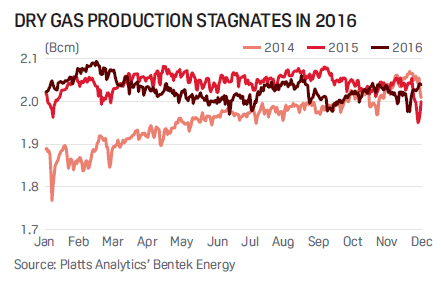
However, the supply/demand picture for US natural gas in 2016 was not as comfortable as many had predicted.
Demand increased, not just from liquefaction, which still represents only a fraction of gas use, but from other sources, such as pipeline exports to Mexico and the huge ongoing switch away from coal-fired generation to gas-for-power.
Not only that but output growth peaked and production started to decline. The collapse in oil prices from the summer of 2014 saw drilling activity plummet. The gas rig count was down, but so too was the number of oil rigs and, as a result, the supply of associated gas.
Tightening balance
According to data from Platts Analytics' Bentek Energy, US dry gas production fell 0.6% in 2016 to 740.43 Bcm after having hit record highs in 2015.
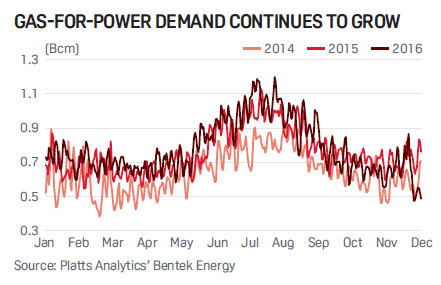
The largest single demand source for US gas in 2016 was the electricity sector. Gas-for-power demand in 2016 stood at 281.43 Bcm, up 3.2% on 2015 and 21.3% higher than in 2014.
Conversely, LDZ demand extended its recent decrease to 248.55 Bcm, as opposed to 258.60 Bcm in 2015 and 280.20 Bcm in 2014. Weak LDZ demand during the first quarter of the year more than compensated for spikes towards end-December.
Industrial gas use remained largely unchanged in 2016 in comparison with recent years, totaling 214.98 Bcm, an increase of 0.9% on an annual basis after having been up at 216.94 Bcm in 2014.
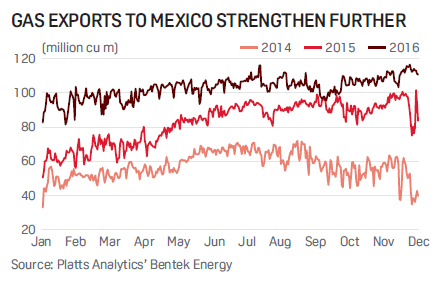
Pipeline exports to Mexico continued to post solid year-on-year increases, reaching 37.25 Bcm in 2016, a hike of 25.1% from 2015 and close to double the 20.52 Bcm exported during 2014.
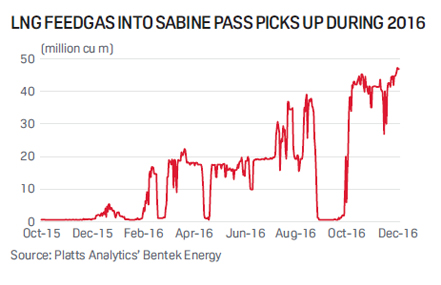
The new demand factor was feedgas for Sabine Pass, which reached 6.58 Bcm in 2016. Overall, gas demand rose 1.8% year-on-year in 2016 to 809.75 Bcm, beating total gas supply by 8.63 Bcm. Demand would have outstripped supply even without the additional LNG feedgas.
Variable demand
Demand from the gas-for-power generation and LDZ sectors combined totaled more than 500 Bcm last year. New coal-fired plant construction has ground to a halt in the US, and the rate of old coal-fired plant retirement has accelerated.
The US is expected to have 459 GW of gas-fired plant by end-2017, up from 423 GW at end-2012.
Rising use of gas-for-power generation creates its own stresses and strains, as gas demand becomes more sensitive to temperature variations.
The southern states see electricity demand peak in the summer months, owing to the use of air conditioning, while northern demand is heavily affected by cold in the winter.
LDZ demand is similarly affected. Despite having posted an annual fall last year, demand reached over 280 Bcm in 2014, more than 30 Bcm higher than in 2016.
Below-average temperatures saw demand during December 2016 up 37.2% year-on-year.
This variability cannot be controlled by government or suppliers, and given the tightening system balance, US weather is set to become an important driver for the global gas price.