


17 Dec 2015 | 10:31 UTC — Insight Blog
US natural gas is high, low, and looking to 2016

If I had to sum up the US natural gas industry of 2015 in four words, they would be: high production, low prices. This year has indeed been a year that some people — such as consumers — will want to remember, while others — namely, producers — will want to forget.
It was one of those years when prices continued to drop, and market observers seemed to be holding their breath, waiting to see when prices would rebound. With just a few more weeks left in the year, it seems like we will still be holding our breaths at least into 2016.
Looking at natural gas supply, demand, and prices at hubs throughout the US on a daily basis all year, I wanted to share some of the most eye-opening year-over-year figures that I have come across while covering the market. Unless noted otherwise, in this piece I will be comparing 2015 averages year-to- date (with December 10 being our date) to the same time period in 2014.
What I hope to convey is just how challenging of a price environment 2015 has been for producers and just how resilient producers have been amid this downright pathetic price environment.
Prices
As of December 10, the NYMEX prompt-month contract in 2015 has averaged $2.66/MMBtu, 38.3% lower than the same time period in 2014, when the prompt-month’s contract average price was $4.31/MMBtu.
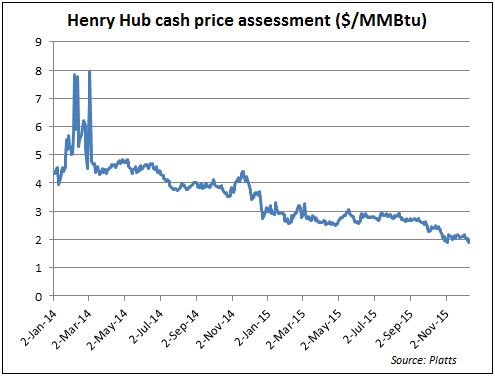
Cash prices at Henry Hub have been similar to the NYMEX contract. Year-to-date Henry Hub prices have averaged $2.658/MMBtu, a 39.7% decline compared to the same time period in 2014, when Henry Hub averaged $4.40/MMBtu.
Therefore, as a producer, two popular options for selling your gas this year has yielded returns that are nearly 40% lower than a year ago.
For producers working out of the prolific Marcellus and Utica formations, which is now the country’s largest producing region, cash prices at one the most liquid hub, Dominion, South Point, have been miserable. Year-to-date Dominion South prices have averaged $1.49/MMBtu this year, a 55% decline from a year ago, when the average price fetched at Dominion South was $3.33/MMBtu. I hate to beat a dead horse, but it is difficult to overstate how sobering and challenging it is for producers to work with such low prices.
Production
And yet, 2015 has been a stellar year for natural gas production. No matter how you look at or break down the numbers, the word “impressive” continues to be at the tip of my tongue.
US natural gas production has averaged 71.9 Bcf/d in 2015, a 3.2 Bcf/d increase from a year ago. It is easy to forget the magnitude of just how much 71.9 Bcf/d of gas really is. To put this figure in perspective, Russia, the second largest producer with the world’s reserves, produced an average of 57 Bcf/d in 2014. The country with the world’s largest natural gas reserves is Iran, produced about 16.5 Bcf/d in 2014.
Put another way: Just the increase in US natural gas production over the past 6 years is equal to Iran’s total production.
Even the increase of gas production from a year ago of 3.2 Bcf/d is very impressive. Mexico as a whole has managed to produce just over 4 Bcf/d in 2015. Therefore, our year-over-year increase in natural gas production is over 75% of Mexico’s total production.
How is the US producing such record levels of natural gas? If you look at the Baker Hughes rig count report, rig numbers no longer indicate levels of production. At the end of November this year, the natural gas rig count stood at 187 rigs, the lowest number of gas rigs on record, which goes back to 1987.
When looking at rig counts, one should consider just how astonishingly effective rigs have become. In July, EQT, a large player in the Utica, set an on-shore shale world record when their rig drilled a well that produced an initial production rate of 72.9 MMcf/d.
Numbers like these are why shale gas production has grown to be such a large part of US supply. Energy Information Administration data shows US shale gas production was 5% of total US natural gas production in 2004, 10% in 2007, and is now 56% in 2015. Considering how shale gas has been the primary driver in overall supply, shale wells will continue to be drilled.
Demand
Total US demand is only up 1.7 Bdf/d from a year ago, averaging 72.8 Bcf/d in 2015. If it was not for residential/commercial demand, which comes in at 24.5 Bcf/d, down 1.8 Bcf/d from a year ago to (weather driven), total US demand growth could have been impressive because US power burn is up 3.8 Bcf/d to 26.2 Bcf/d from a year ago. Power burn has grown for a number of reasons, such as fuel switching, coal retirements, and a higher level of nuclear maintenance outages from a year ago.
South of the border, Mexican demand for US gas has been strong, growing 700 MMc/d year to date to 2.7 Bcf/d in 2015. December exports to Mexico have averaged 3.2 Bcf/d so far.
Conclusion
While natural gas producers have been hammered in 2015, it is clear that the industry is more efficient, quick-learning, and nimble compared to a year ago. You absolutely need to have these and many other gritty traits to survive this low-cost environment.
I invite all readers to share their thoughts on the gas market in 2015 and pitch what you foresee shaping out in 2016, and I hope everyone can enjoy some happy holidays, regardless of what the markets may bring.
|
|
||||
| Request a free trial of: Gas Daily |  |
|||
 |
Gas Daily offers the most detailed coverage of natural gas prices at interstate and intrastate pipeline and pooling points in major U.S. markets. Gas Daily keeps you informed about complex state and federal regulations that affect competition in the gas industry. | |||
 |
||||
|
|
||||