


17 Nov 2017 | 10:31 UTC — Insight Blog
US IRRs strengthen as WTI reaches year-to-date highs

Featuring Matt Andre
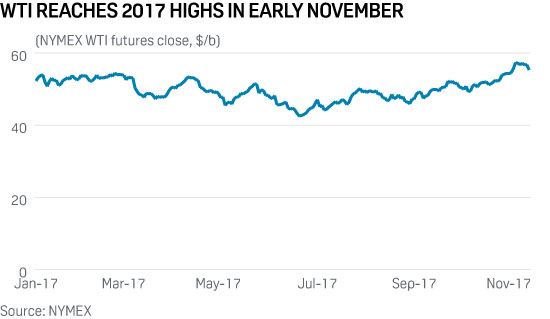
November is upon us and temperatures across the US are beginning to fall as oil prices rise to year-to-date highs. Looking at the average 12-month forward curve for WTI, oil prices rose to $54.19/b in early November, an increase of $2.62/b month over month.
The price increase has allowed internal rates of return (IRR) to climb by 3 percentage points, on average, across the top five oil plays in the US (Permian, Eagle Ford, Bakken, STACK and the DJ). Returns in West Texas' Permian Delaware climbed to 37.4%, with the Permian Midland trailing just behind at 34%, achieving IRR levels that haven't been observed since Q1 2017.
Pioneer Resources, a top operator in the Permian, indicated that at a crude price of $50/b and gas price of $3/MMBtu, its rate of return in the basin ranges from 45% to 75%. Producers tend to report their strongest wells, which could explain the variances between IRRs; Platts' calculation looks at "a typical well within each play" which considers average initial production rates and average drilling and completion costs.
A result of strong IRRs, rig activity across the Permian basin is up 22 rigs compared with the prior month, which is impressive due to the fact that total US counts are relatively flat to October. Permian rig additions were split evenly between the Delaware and Midland basins, bringing the active rig total to 408 for November 3 — with the basin as a whole accounting for 40% of the current US rig count.
Some of the areas that have dipped in activity month on month are California's San Joaquin (-8), Kansas' Anadarko basin (-6) and the Nemaha Uplift in Oklahoma (-4), working together to offset the rig count growth provided by the Permian. It's no surprise the basins experiencing a decline in rig counts still remain below breakeven (or 10% return) for a typical well.
On the gas side, the average 12-month forward curve for Henry Hub dropped $0.09/MMBtu to $2.93/MMBtu. The overall impact to the gas-rich plays was minimal, with returns in the Marcellus and Utica averaging at just over a 1 percentage point drop.
In the Haynesville, initial production (IP) rates in the Platts Well Economics Analyzer (WEA) have been adjusted higher based on a combination of state production data and producer earning reports. The IP rate assumption for a typical well in the Haynesville was increased from 10 MMcf/d to 11 MMcf/d, which helped to drive down the gas breakeven cost from $3.14/MMBtu to $2.94/MMBtu within the basin, bringing the estimate more in line with what producers are reporting.
Rig activity in the gas-rich plays has remained relatively flat month on month. The Northeast (Marcellus/Utica) is down two rigs from the prior month, bringing the total to 77 rigs. The story is similar in the Haynesville with the region down two rigs, bringing the basin's total down to 43 rigs.
Based on the WEA model, all of the dry gas plays are currently hovering around a 10% return (or breakeven) but it is worth mentioning that there are reports of wells with IP rates in the 25 MMcf/d range, which would spike returns to 50%-70% assuming all other variables are held constant.