


08 Nov 2017 | 10:31 UTC — Insight Blog
With Trump’s commodity gestation period done, most prices still soft: Of Presidents and Prices

It has been a little more than nine months since President Donald Trump took office, and although most hard commodity prices are lower than the day he was sworn in, there are signs of life.
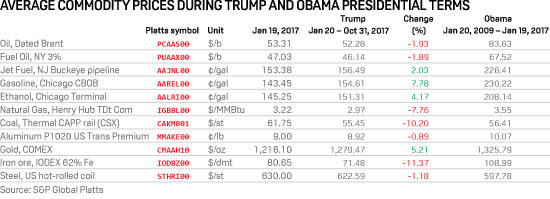
For the first time since July 2, 2015, the price of Dated Brent — driven by strong demand — topped $60/b in late October, pushing its running average during the Trump presidency to $52.28/b. That’s still below the price of Dated Brent the day before Trump took the oath of office — $53.31/b on January 19 — and almost 38% below the $83.63/b average during Barack Obama’s two terms.
S&P Global Platts has been monitoring a group of 11 price benchmarks and comparing them in Trump’s term thus far versus Obama eight years in office — although fundamentals and a range of other factors influence commodity prices.
Seven of the 11 commodity prices tracked by Platts are still weaker than when Trump entered the White House on January 20, despite Q2 and Q3 US GDP growth of 3.1% and 3%, respectively. There were eight separate quarters when US GDP grew by more than 3% under Obama, although it never increased more than 3% on an annual basis.
The prices of four of the 11 are up since Trump took office: jet fuel (2%), gasoline (7.8%), ethanol (4.2%), and gold (5.2%).
Among the seven benchmarks that are weaker, iron ore and thermal coal are down most sharply — 11.4% and 10.2%, respectively, followed by natural gas at 7.8%.
Read the last iteration of the Of Presidents and Prices series here.