Customer Logins
Obtain the data you need to make the most informed decisions by accessing our extensive portfolio of information, analytics, and expertise. Sign in to the product or service center of your choice.
Customer Logins
ECONOMICS COMMENTARY
Mar 22, 2019
IHS Markit US PMI signals greatest pressure on corporate earnings since 2016

- PMI survey data provide an accurate advance guide to corporate earnings growth
- EPS gauge is derived from survey indices measuring sales, pricing power and profitability
- First quarter earnings momentum at three-year low
The US PMI surveys produced by IHS Markit provide a valuable advance insight into economic trends, but also act as a reliable indicator of corporate earnings. With the first quarter earnings reporting season about to start, we look at the signals from the recent surveys.
Manufacturing-led slowdown
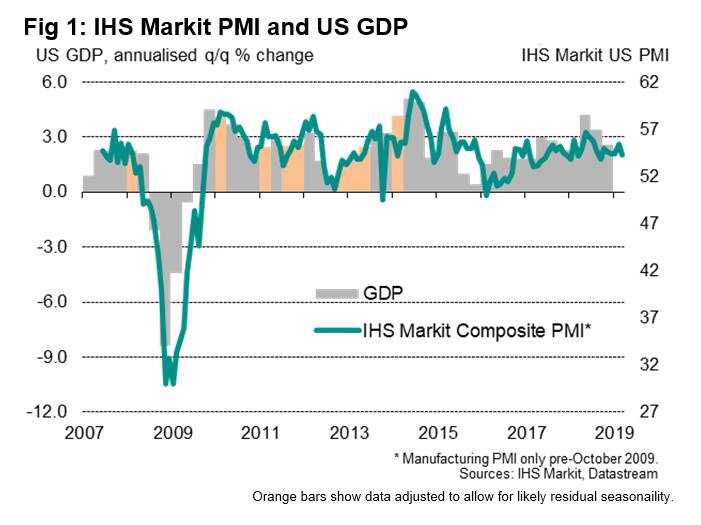
The surveys indicate that growth has moderated since the robust gains seen this time a year ago, especially in the goods-producing sector. The 'composite' index, which pulls together the data from the manufacturing and service sector PMIs and acts as an accurate 'nowcast' tool for GDP, correctly indicated that the pace of economic growth slowed in the fourth quarter (our model from the survey indicated 2.5% growth against an initial official estimate of 2.6%). The index has since shown no re-acceleration in the first quarter (see fig 1).
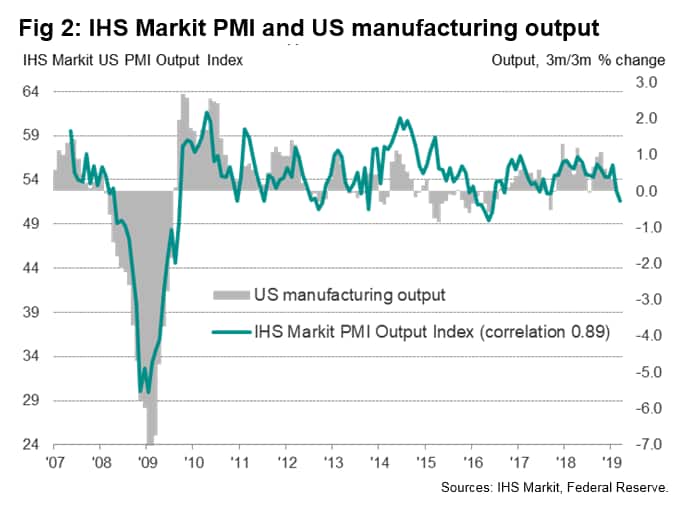
Businesses in fact reported that output growth eased to the second-lowest seen over the last year, according to the flash PMI results for March. Although the headline PMI remains encouragingly resilient, indicative of the economy growing at an annualised rate in excess of 2% (suggesting some potential upside to many current growth forecasts), signs of the business environment becoming tougher have intensified in recent months, especially in manufacturing, where the survey is consistent with falling factory output and order books (see fig 2).
Weaker forward-looking indicators
Growth is also likely to cool further, according to the survey's sub-indices, and companies may soon seek to reduce capacity. Whereas new orders were growing at a faster rate than companies could boost output throughout much of last year, the surveys are now showing signs that demand is insufficient to sustain current output levels. Similarly, in manufacturing, the forward-looking new orders to inventory ratio hit a 18-month low in March and suppliers' delivery delays (a key indicator of capacity utilisation) indicated the fewest delays for 16 months in March.
At the same time, business optimism about the outlook has also cooled to the lowest since mid-2016 amid worries over the impact of tariffs, trade wars, higher prices and rising interest rates.
Earnings under pressure
The headwinds to business indicated by the surveys bode ill for corporate earnings growth, a deeper insight into which can be gleaned from analysis of other survey sub-indices against historical earnings growth. In this respect, the surveys indicate that earnings have been under their greatest pressure for three years in recent months.
IHS Markit PMI earnings indicator components
To estimate the trend in earnings growth we have compiled an indicator based on five components, all derived from IHS Markit's US PMI surveys, which provide insights into sales growth, pricing power and profitability:
- Total order book situation: a blended index of the composite new orders and backlogs of orders questions providing an overall indication of sales growth (weight 1.3)
- Output prices: based on the composite PMI average prices charged index, providing an indication of pricing power among goods producers and service providers (weight 0.7)
- Backlogs of work: the composite survey index covering work received but not yet completed, which helps indicate the extent to which demand is running ahead of capacity and therefore acts as a further guide to both sales and pricing power (weight 0.7).
- Productivity: the ratio between composite PMI output and employment indicators which provides an insight into labour productivity, itself a key determinant of profitability (weight 0.2)
- Suppliers' delivery times: a key gauge of capacity constraints and pricing power (weight 0.3)
The above components are calculated by first comparing the current month's value to the trailing six-month average. The components are charted here against earnings growth (note that in these charts we use three-month averages to illustrate the trends). We compare the components against the reported earnings per share in S&P500 companies over the prior 12 months, as measured by Case Shiller, and specifically the current month's EPS value against the prior six-month trailing average.
Individual components are then weighted together to form a composite earnings momentum gauge (see fig 3). The resulting index exhibits a correlation of 75% against this measure of earnings growth with an advanced lead of four months, which rises to 83% if a moving average is used to reduce some of the indicator's volatility.
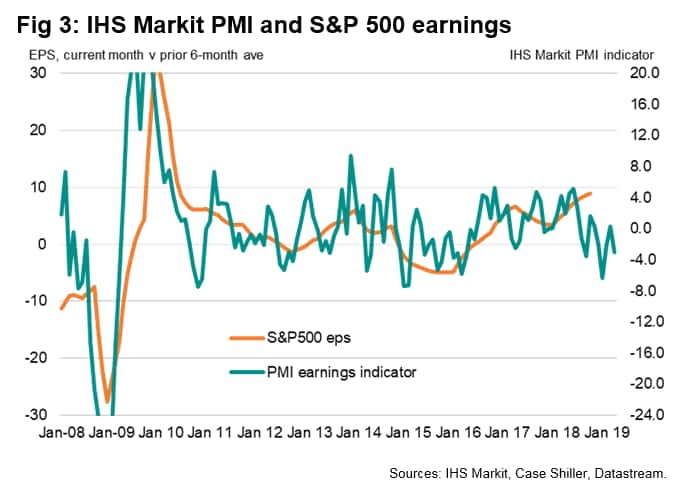
The average earnings growth momentum signalled by the indicator in the first quarter is the lowest recorded since the first quarter of 2016, a time when earnings were falling at an annual rate of 12.9%.
Please note that the indicator is merely designed to provide a simple guide to earnings trends, and further research may yield higher correlations and improved predictive ability. Further work can also be undertaken to analyse the PMI signals by sector, using IHS Markit's Sector PMI dataset.
For more information contact economics@ihsmarkit.com.
Chris Williamson, Chief Business Economist, IHS
Markit
Tel: +44 207 260 2329
chris.williamson@ihsmarkit.com
© 2019, IHS Markit Inc. All rights reserved. Reproduction in whole or in part without permission is prohibited.
Purchasing Managers' Index™ (PMI™) data are compiled by IHS Markit for more than 40 economies worldwide. The monthly data are derived from surveys of senior executives at private sector companies, and are available only via subscription. The PMI dataset features a headline number, which indicates the overall health of an economy, and sub-indices, which provide insights into other key economic drivers such as GDP, inflation, exports, capacity utilization, employment and inventories. The PMI data are used by financial and corporate professionals to better understand where economies and markets are headed, and to uncover opportunities.
This article was published by S&P Global Market Intelligence and not by S&P Global Ratings, which is a separately managed division of S&P Global.
{"items" : [
{"name":"share","enabled":true,"desc":"<strong>Share</strong>","mobdesc":"Share","options":[ {"name":"facebook","url":"https://www.facebook.com/sharer.php?u=http%3a%2f%2fwww.spglobal.com%2fmarketintelligence%2fen%2fmi%2fresearch-analysis%2fus-pmi-signals-greater-pressure-on-corp-earnings-220319.html","enabled":true},{"name":"twitter","url":"https://twitter.com/intent/tweet?url=http%3a%2f%2fwww.spglobal.com%2fmarketintelligence%2fen%2fmi%2fresearch-analysis%2fus-pmi-signals-greater-pressure-on-corp-earnings-220319.html&text=S%26P+Global+US+PMI+signals+greatest+pressure+on+corporate+earnings+since+2016+%7c+S%26P+Global+","enabled":true},{"name":"linkedin","url":"https://www.linkedin.com/sharing/share-offsite/?url=http%3a%2f%2fwww.spglobal.com%2fmarketintelligence%2fen%2fmi%2fresearch-analysis%2fus-pmi-signals-greater-pressure-on-corp-earnings-220319.html","enabled":true},{"name":"email","url":"?subject=S&P Global US PMI signals greatest pressure on corporate earnings since 2016 | S&P Global &body=http%3a%2f%2fwww.spglobal.com%2fmarketintelligence%2fen%2fmi%2fresearch-analysis%2fus-pmi-signals-greater-pressure-on-corp-earnings-220319.html","enabled":true},{"name":"whatsapp","url":"https://api.whatsapp.com/send?text=S%26P+Global+US+PMI+signals+greatest+pressure+on+corporate+earnings+since+2016+%7c+S%26P+Global+ http%3a%2f%2fwww.spglobal.com%2fmarketintelligence%2fen%2fmi%2fresearch-analysis%2fus-pmi-signals-greater-pressure-on-corp-earnings-220319.html","enabled":true}]}, {"name":"rtt","enabled":true,"mobdesc":"Top"}
]}