June 2025 S&P Capital IQ Pro Release Notes
Table of Contents June 2025 S&P Capital IQ Pro Release Notes
S&P Capital IQ Pro Release Highlights
In this release, we added new datasets and tools on Capital IQ Pro, designed to enhance our client's daily workflows:
Visible Alpha Estimates: We introduced Excel export options and enhanced click-through audit capabilities for Visible Alpha Estimates growth metrics, in addition to making Visible Alpha Peer Comps, a company's business groups and tailored peer lists, accessible to all users. GenAI Enhancements: We are excited to introduce Chart Explainer, a GenAI-driven feature that summarizes key insights and trends in stock movements, along with the new ‘@Help’ function in ChatIQ for quick access to Help Center support content. Private Markets: We enhanced Headcount Analytics by adding department and role metrics, including growth and attrition rates in Screener, and introduced eight new Topic Tags to improve deal sourcing workflows in niche sectors. Content Expansion: We introduced iBoxx Fixed Income Indices to enhance liquid tradable index solutions, added North American Production data to the Upstream Oil & Gas offering, and included new Credit Union Summary metrics, Uninsured Deposits and Basel III Leverage Ratio Cushion in Screener for Banks. Mobile App: We enhanced the Capital IQ Pro mobile app homepage for easier discovery of S&P 500 earnings events, optimized it for iPad users, and introduced a new investment research widget and ownership module for quick access to relevant data and analyst content.
Visit S&P Capital IQ Pro and Contact Us for additional details. Visible Alpha Estimates
In this release, we added Excel export options and improved click-through audit capabilities for year-over-year and sequential growth metrics. These features empower users to seamlessly integrate Visible Alpha data into their Excel worksheets while offering greater transparency in analyzing company growth.
Excel Export for Visible Alpha Pages
Users can now export Visible Alpha formulas directly from the platform into the S&P Capital IQ Pro Plug-in, using the ‘Export to Excel’ option, including ‘Export as Formulas.’ Users must have the S&P Capital IQ Pro Plug-in installed to leverage these enhancements. Additionally, the ‘Export as Values’ option enables users to export unlinked data.
Find it in the platform:
- Search for and select a company covered by Visible Alpha from the top search e.g., NASDAQGS:AAPL
- In the left-hand navigation menu, under Visible Alpha, select Key Values
- Click Export in the upper-right-hand of the page
- Select Export to Excel as Formulas
- Once the download is complete, open the file in Excel, where you can refresh the formulas using the S&P Capital IQ Pro Plug-in
Note: Access to Visible Alpha estimates data needs an additional subscription, please contact your account team for details.

Click Through Audit Capabilities
Users can now use the click-through audit functionality for analysis of year-over-year and sequential growth metrics of Visible Alpha within Capital IQ Pro. This enhancement provides deeper insights and transparency into the underlying calculations, in addition to the existing click-through to source documents.
Find it in the platform:
- Search for and select a company covered by Visible Alpha from the top search e.g., NASDAQGS:AAPL
- In the left-hand navigation menu, under Visible Alpha, select Key Values
- Click Analytics in the filter menu at the top of the page
- Expand the plus (+) sign next to any line item e.g., Total Revenue
- Click on any growth datapoints, e.g., in the FY2025 column, click YOY%
- The click-through pop-up will display the underlying calculation, e.g., the % difference between the FY2025 Revenue estimate and the FY2024 Revenue Actual
Note: Access to Visible Alpha estimates data requires an additional subscription. Broker entitlements are required to view underlying broker estimates and download analyst models. Please contact your account team for details.

Peer Comps
With this release, Visible Alpha Peer Comps are now accessible for all users. The Visible Alpha peer groups are created based on the Visible Alpha metrics to identify a company's different business groups and relevant lists of peers within each of these groups.Visible Alpha Peer Comps for All Capital IQ Pro Users
All Capital IQ Pro users can now access peer groups created by Visible Alpha analysts. Users can view a company's set of business groups and tailored peer lists for each group and can save these peer lists to use throughout the platform. Users subscribed to Visible Alpha can explore the deep metrics available for these peer groups.
Find it in the platform:
- Search for and select a company covered by Visible Alpha from the top search
- On its company profile, navigate to Profile > Peer Comps in the left-hand navigation
- View the tabs next to Peers tab to view the different business groups the company operates in e.g., Internet Retailers
- The Key Metrics tab displays a list of companies and metrics relevant to this peer group
- To drill into a single metric and view data over multiple periods, click the plus + sign next to the Key Metrics tab
- In the Add Trend window, select a metric, and click Apply
- Select Save List to use this peer list throughout the platform
- Select Export to export the peer list to Excel
- Select View Metrics to view the metrics available for this peer group
Note: Access to Visible Alpha estimates data needs an additional subscription, please contact your account team for details.

Charting
In this release, we are excited to unveil Chart Explainer, a GenAI-driven summary of news and significant events on our Stock Chart. This feature offers key insights into a company's stock movement over time. Additionally, we introduced 19 most commonly used financial metrics for companies and 14 macroeconomic data metrics applicable across all geographies in Chart Builder.Chart Explainer on Stock Charts
Chart Explainer harnesses GenAI to efficiently summarize key insights and trends observed from a company’s price movements or performance within the selected time range.
Find it in the platform:
- Search for and select a public company in the top search bar e.g., NYSE:SPGI
- In the left-hand navigation menu, select Stock Chart
- Click on the Chart Explainer option to open the right-hand module that provides insights into the stock chart
- Choose two distinct time points on the stock chart to generate a summary of the selected data
- To modify your search, click on the Select a New Date located at the bottom of the summary and click on two new dates on the chart to update the summary
- To remove the summary and explore other functionalities of the chart, click the X in the upper right-hand corner of the module
Coverage stats:

Key Financial and Macroeconomic Data Metrics in Chart Builder
Users can now chart 19 most commonly used financial and 14 macroeconomic metrics within Chart Builder. Financial data can be plotted for Fiscal Year, Fiscal Quarter, Calendar Year, Calendar Quarter, and LTM as available. These new metrics enable users to visualize a company's performance and identify economic trends, supporting informed strategic decisions and long-term planning.
Find it in the platform:
- Navigate to Chart Builder from the top navigation or the Apps menu
- Input a company name or select a geography/country to add to the chart
- Select a corresponding financial or macroeconomic data metric from the Metric Selector, or choose a template from the Templates section to add to the chart
Coverage stats:
- Financial Metrics: Total Revenue, Gross Profit Margin, EBIT, EBIT Margin, EBITDA, EBITDA Margin, Net Income, Net Income Margin, ROAE, Total Equity, Total Assets, Total Debt, Common Dividends Declared per Share, Net Operating Income NOI, Dividend Yield, FFO, Adjusted FFO
- Macroeconomic Metrics: Real GDP Growth, Nominal GDP, Population, Population Growth, GDP Per Capita, Consumer Price Inflation, Money Market Interest Rate Change, Producer Price Inflation, Public Debt/GDP, Budget Balance/GDP, Unemployment Rate, Current Account Balance /GDP, Foreign Debt/GDP, Exchange Rate, Average


Private Markets
In this release, we are adding eight new Topic Tags to enhance the deal sourcing workflows of niche sectors. Additionally, we added department and role analytics, including key metrics such as growth rate and attrition rate for Headcount data in Screener. We also launched new idea generation screens tailored to common workflows for fund managers and fund-level analysis to enable more targeted access to relevant insights.New Topic Tags
Users can access eight new Topic Tags - Pharmacovigilance, HRTech, Sports Analytics, Fitness Technology, Wellness and Recovery, Corporate Wellness Programs, Edtech, and WorkTech via the Market Maps, Screener, and Corporate Profiles pages for ~90k private companies. These tags allow users to identify companies that operate in these niche markets and support the deal sourcing workflow.
Find it in the platform:
- Market Maps:
- Navigate to Markets from the top navigation
- Select Market Maps and choose a Topic Tag to deep dive into the deal activity
- Screener:
- Navigate to Screener from the top navigation or the Apps menu
- In the Field Selector, go to General Business Details > Topic Tags to see the new additions
Coverage Stats:

Headcount Analytics Screener Enhancements
Users can now screen private companies using headcount data by role and department, along with key metrics such as growth rate, attrition rate, and employee tenure at the role level.
Find it in the platform:
- Navigate to Screener from the top navigation or the Apps menu
- Expand Company Details > General Business Details > Headcount Analytics folder
- Select the required metrics with the needed parameters

Fund Manager and Fund Idea Generation Screens
Users can access ten new idea generation screens for PE/VC fund managers and fund-level analysis, enabling faster and targeted access to relevant insights during fundraising.
Find it in the platform:


Document Intelligence
In this release, we elevated Document Type to a global filter, simplifying access and enhancing search retrieval. Key functional improvements include an updated default filter for Time Range, persistent landing page views, and the integration of Boolean synonyms into the Document Viewer. Additionally, we made updates to enhance clarity in ChatIQ error handling, enable seamless company header navigation, a refreshed play button for transcripts, and provide shortened shareable links for Investment Research documents.Document Type as a Global Filter
Users can effortlessly select or deselect document types from the global filters and easily retrieve them for subsequent searches.
Find it in the platform:
- Navigate to the Documents tab in the top navigation to access Document Intelligence page
- Apply any search filter for Document Type and select or deselect documents as required

Page View Stickiness
Users can maintain their preferred view on the Document Intelligence landing page, whether in tile or list format, along with expanded views from their last session.
Find it in the platform:
- Navigate to the Documents tab in the top navigation to access Document Intelligence page
- On the landing page, either expand the Filings tile or go to All Documents view
- Close the active window and reopen the Document Intelligence page
- The same view will be maintained in the new session

Boolean Synonym Support in Document Viewer
Users can view selected or deselected synonyms from the Document Intelligence landing page in the Document Viewer. Additionally, any new search conducted within the Document Viewer will display the applied synonyms. Users have the flexibility to select or deselect synonyms in the Document Viewer to either narrow or expand their search results.
Find it in the platform:
- Navigate to the Documents tab in the top navigation to access Document Intelligence page
- In the Keyword filter, enter a keyword or Boolean search
- Select a document by clicking on search results or opening it in a new tab
- Click on the Show Synonyms option to expose synonyms applied to the current search
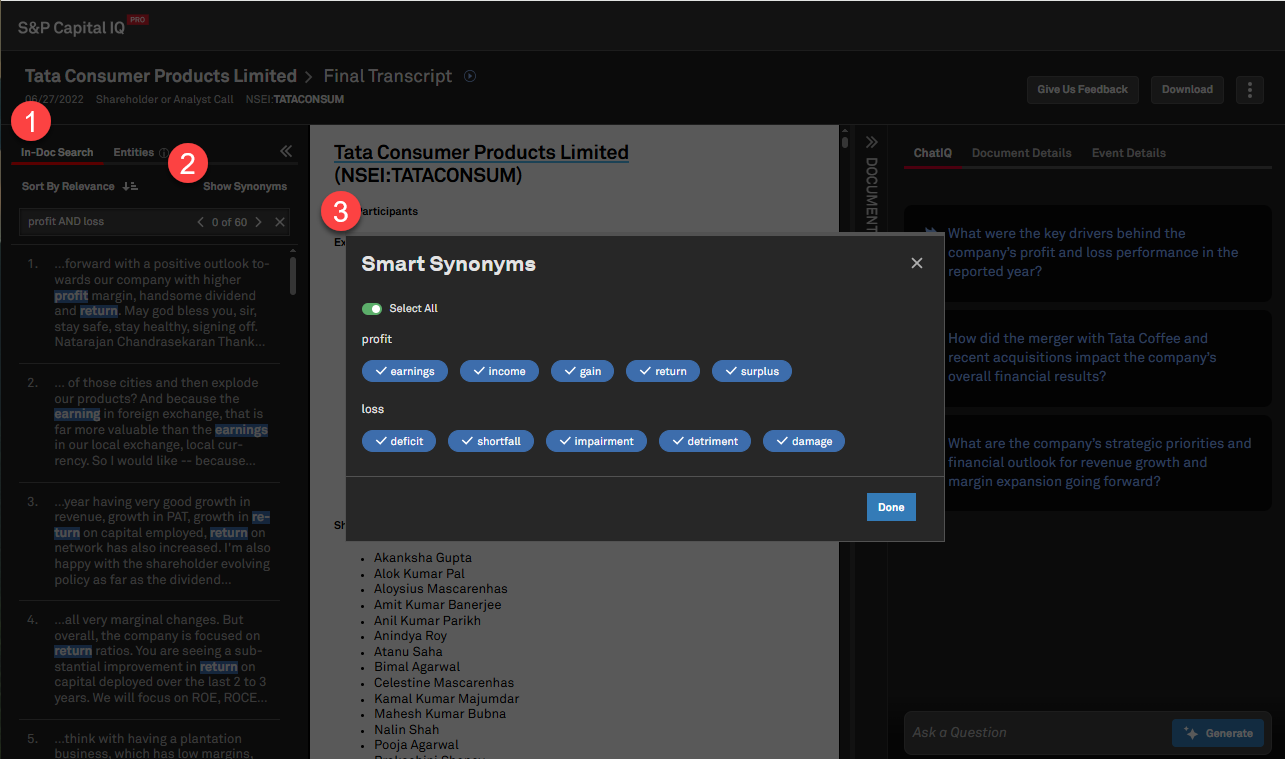
Sort by Relevance for In-Document Search
Users can sort search results in documents by relevance, in addition to sorting by chronological order, allowing to surface more relevant results.
Find it in the platform:
- Navigate to the Documents tab in the top navigation to access Document Intelligence page
- Apply any search filter, such as entity, keyword and click on a document
- Access a drop-down menu which allows to sort results by relevance or by chronological order
- The new Sort by Relevance option will be set as the default
- If the user changes the setting, the chosen order will continue in succeeding searches

Usability Enhancements
Users can now directly navigate to the Corporate Profile from the Document Viewer by clicking on the company name in the document title. Additionally, we shortened the shareable links of Investment Research documents and updated the play button of Transcripts to be more visible and accessible.
Find it in the platform:
- Navigate to the Documents tab in the top navigation to access Document Intelligence page
- On the landing page, type a keyword or apply any global filter
- Open a document and click on the title to navigate to the Corporate Profile
- Select an Investment Research document shareable
- Navigate to Transcripts and open any call type to view the audio play button

ChatIQ
In this release, we introduced the new ‘@Help’ function in ChatIQ, our GenAI assistant, enabling users to quickly access relevant support content from the Help Center. Users can ask questions to find information on data methodologies, retrieve basic Excel formula syntax and use this interactive feature as a 'how-to' guide.@Help Function on ChatIQ
Users can type ‘@Help’ followed by a question to retrieve curated answers from S&P Capital IQ Pro’s Help Center. This feature enables users to quickly find answers on data methodologies (e.g., calculation of Total Enterprise Value), understand data timeliness (e.g., ownership data timeliness), Excel formula syntax (e.g., formula to retrieve Revenue), access how-to guides (e.g., how to download the Excel Add-In?), and more. Users will also have direct links to the full Help Center articles.
Find it in the platform:
- Navigate to the Apps tab from the top navigation and select ChatIQ
- Use the Ask a Question text bar, type @Help followed by a question for ChatIQ to answer and use the Generate button to submit
- Review the answer and click the links to navigate to the source Help Center articles
- After asking a question, you can let us know about your experience by using the Thumbs-up, Thumbs-down, and Feedback options

Search
In this release, we enhanced search discoverability features to enhance information retrieval efficiency. This includes additional sorting options, and support for special characters. We also enhanced rates and yields and improved the discoverability of new indices.
Enhancements to Company Card in Search
The company card for public companies in search will now feature top page links, clickable stock charts, dynamic currency on the Y-axis, and improved user experience for search functionality. These updates aim to provide quicker access to company information within the search experience.
Find it in the platform:
- Navigate to the search bar within the top navigation menu and enter keywords to find any public company
- The enhanced company card will be displayed in the Companies tab on the right-hand side of the search modal

Discover Fixed Income Indices in Search
Users can now search for Fixed-Income Indices within Capital IQ Pro search. Users can access a new sub-category for Fixed-Income Indices in the top search and additional filters in advanced search to easily discover the key indices.
Find it in the platform:
- Navigate to the search bar within the top navigation menu and enter keywords to find any fixed income index on the All or Indices tab
- Click on Advanced Search at the top right of the search results
- On the left-hand navigation, click Markets & Industry Assets > Indices and filter for Fixed Income Indices within the Select Index Type filter


Special Character Support for Filings, Transcripts, News Search
Users can search for keywords with special characters within unstructured content sets such as Filings, Transcripts and News. Supported special characters include ampersands (&), apostrophes (‘), hyphens (-), and many more. This generates more relevant search results for companies, product names, or file types that include special characters.
Find it in the platform:
- Navigate to the search bar within the top navigation menu and go to Advanced Search at the top right of the search results
- Select either Filings, Transcripts, or News content
- Search with keywords having special or accented characters
- Or Navigate to the Documents tab in the top navigation to access Document Intelligence page
- Select either Filings, Transcripts or News content
- Search with keywords having special or accented characters

Expanded Rates & Yields Coverage
Users can now access select swap, reference, and index rates on search, including SONIA, SOFR, and EURIBOR. This enhancement offers comprehensive coverage of these frequently used rates, along with the introduction of forward rates, enhancing benchmarking capabilities with Fixed Income data.
Find it in the platform:
- Navigate to the search bar within the top navigation menu and enter keywords to find any Rates & Yields
- Click on the Advanced Search at the top right of the search results
- On the left-hand navigation, click Markets & Industry Assets > Rates & Yields and filter for Risk Free Rates in the Select Rate Type filter

Market Data
In this release, we introduced iBoxx Fixed Income Indices, offering comprehensive benchmarking and liquid tradable index solutions that track global bond markets. We also enhanced our Index Market Capitalization metric’s data coverage to include a significantly wider spectrum of broad-market indices. Additionally, index-level Total Enterprise Value, Dividend Yield, Annual Dividend Rate and Market Capitalization can now be retrieved within the S&P Capital IQ Pro Plug-in.iBoxx Fixed Income Indices
Users can now access pricing and fixed income metrics for the below indices:
- iBoxx $ Liquid High Yield Index
- iBoxx $ Liquid High Yield Index CAD
- iBoxx $ Liquid Investment Grade Index
- iBoxx GBP Green Bonds Select Index
- Markit iBoxx Global Developed Markets High Yield Index (USD Unhedged)
- iBoxx TIPS Inflation-Linked Index
- iBoxx TIPS Inflation-Linked Index 5+
- Markit iBoxx Global Developed Markets High Yield USD Sub-Index
- iBoxx USD Green Bonds Select Index
Find it in the platform:
- Search for and select an iBoxx Index from the top search
- Navigate to the Index Profile page


Index Market Capitalization
Users can now access market capitalization data for a significantly wider universe of broad-market indices, from multiple index providers.
Find it in the platform:
- Navigate to the Dashboard from the top navigation
- Select List widget from the Add Widget menu at the top right to add it to the Dashboard
- Open Field Selector using the settings gear icon at the top-right corner of the widget
- In the Field Search bar, input Market Capitalization, select the indicated field and add it within the List widget

Index Data Expansion in S&P Capital IQ Pro Plug-in
Users can now retrieve Index-level Total Enterprise Value, Dividend Yield, Annual Dividend Rate and Market Capitalization within the S&P Capital IQ Pro Plug-in.
Find it in the Platform:
- Launch S&P Capital IQ Pro Plug-in and open Formula Builder
- Navigate to Companies Data > Market Data > Equity Market Data > Market Cap., TEV and Shares
- Add an existing S&P Index identifier and select Market Capitalization and TEV metrics
- Navigate to Companies Data > Market Data > Equity Market Data > Dividend and Yield
- Add an existing S&P Index identifier and select Dividend Yield and Annual Dividend Rate metrics
Example Formulas:
=SPG("^SPX", "SP_MARKETCAP", "06/10/2025")
=SPG("^SPX", "IQ_TEV", "06/10/2025")
=SPG("^SPX", "SP_DIV_YIELD", "06/10/2025")
=SPG("^SPX", "SP_DIV_ANNUAL")
=SPGRANGEV("^SPX", "SP_MARKETCAP", "06/12/2024", "06/12/2025", "Options: Fill=Monthly, Sort=Desc, Dates=Before")
=SPGRANGEV("^SPX", "IQ_TEV", "06/12/2024", "06/12/2025", "Options: Fill=Monthly, Sort=Desc, Dates=Before")
=SPGRANGEV("^SPX", "SP_DIV_YIELD", "06/12/2024", "06/12/2025", "Options: Fill=Monthly, Sort=Desc, Dates=Before")
Metals & Mining
In this release, we introduced a new Modeled Emissions page within Mine Economics in the Property Briefing Book, offering comprehensive emissions data from mine sites. We also expanded the coverage of emissions data of various commodities in Screener and S&P Capital IQ Pro Plug-In. Additionally, we added Iron Ore and Uranium to the commodities list available in the Mine Emissions Curve tool.Introducing Modeled Emissions Page in the Property Briefing Book
Users can access Modeled Emissions with the Mine Emissions add-on subscription within the platform. This page offers detailed insights into Scope 1 and Scope 2 emissions for a mine and is designed to provide information on the fuel or power source at the mine site and a comprehensive view of emissions data.
Find it in the platform:
- Search for and select a Property profile from the top search
- Expand Mine Economics section in the left-hand navigation and select Modeled Emissions Page link
Note: Access to Mine Emissions data requires an additional subscription. Please contact your account team for details.

Mine Emissions data in Screener and S&P Capital IQ Pro Plug-In
Users can access emissions data directly within Screener and the S&P Capital IQ Pro Plug-In. With this release, coverage is expanded to include Cobalt, Lead, Molybdenum, Palladium, Platinum, Rhodium and Zinc.
Find it in the platform:
- Screener
- Navigate to Screener from the top navigation or the Apps menu
- Select Metals & Mining Properties dataset and expand Mine Emissions Data category from Display Columns under the Results section
- Expand individual sub-categories to find the newly added commodities
- S&P Capital IQ Pro Plug-In
- Launch S&P Capital IQ Pro Plug-in and open Formula Builder
- Select Metals & Mining Properties dataset, and expand Mine Emissions Data
- Expand individual sub-categories to find the newly added fields
Coverage stats:
- Cobalt, Copper, Gold, Lead, Lithium, Molybdenum, Nickel, Palladium, Platinum, Rhodium, Silver, and Zinc.
Note: Access to Mine Emissions data requires an additional subscription. Please contact your account team for details.

Enhanced Commodity Coverage in Mine Emissions Curve tool
Users can access enhanced coverage of commodities in the Mine Emissions tool, with Uranium added to the existing list, offering a comprehensive view of emissions data.
Find it in the platform:
- Navigate to Metals & Mining from the top navigation bar
- Click on Mine Emissions to access the page
Coverage stats:
- Cobalt, Copper, Gold, Lead, Lithium, Molybdenum, Nickel, Palladium, Platinum, Rhodium, Silver, Uranium and Zinc
Note: Access to Mine Emissions data requires an additional subscription. Please contact your account team for details.
Energy
In this release, we introduced North American Production data to the Upstream Oil & Gas product offering on the S&P Capital IQ Pro platform.North American Upstream Oil & Gas
Users can access North American production data related to Upstream Oil and Gas, including oil, gas, condensate and water, with data aggregations based on wellhead data as provided by Commodity Insights. This data is available for State/Province, Basin, Sub-basin, Play, Sub-play, Field, and Current Operator levels on the North American production page.
Find it in the platform:
- On the Energy profile specialization, click on Natural Gas & Oil from the top navigation
- Under the Upstream Oil & Gas click on the North American Production page
- Expand the filters, select the appropriate filters, and click on Apply filters
- View the returning information and data via the Chart View tab, or click on the Data tab to view the data in a grid format


Banks and Credit Unions
In this release, we added new fields in Screener to assist in peer comparisons and financial performance evaluations. The Credit Union Summary fields have been updated with the most relevant metrics from Call Report filing requirements. The Uninsured Deposits fields display deposits that exceed coverage limits and identify the size of an institution’s uninsured deposit portfolio, providing additional granularity broken up by maturity. As part of the Basel III framework, we added the Basel III Leverage Cushion field to highlight the difference between a bank's calculated leverage ratio and the minimum regulatory requirement.
New Credit Union Balance Sheet and Income Statement Ratios
Users can now access the newly introduced Credit Union summary fields within Screener, which were added to the Balance Sheet/ Assets and Income Statement/ Average Assets folders.
Find it in the platform:
- Navigate to Screener from the top navigation bar or from the Apps menu
- Select Industry & Asset Data > Financials > Regulated Depositories (U.S.)
- Within Criteria, select Company Type as Credit Union and set the Entity Type dropdown to Companies
- Click Display Columns, go to Credit Union Reg Financials Summary or expand U.S. Bank Regulatory Financials within the Companies dataset to find the same fields

New Uninsured Deposits and Basel III Leverage Ratio Cushion fields in Screener
Users can now access the newly added Uninsured Deposits by maturity, Basel III Leverage and Total Capital Ratio Cushion fields in Screener.
Find it in the platform:
- Navigate to Screener from the top navigation bar or from the Apps menu
- Select the Companies dataset and click SNL Financial Fundamentals >
- Banks - US > Industry Supplemental > Deposit Detail > For Uninsured Deposit related fields
- Banks - Non-U.S. > Balance Sheet > Balance Sheet Ratios > For Basel III Leverage Ratio Cushion
- Banks – Global Summary > Balance Sheet > Balance Sheet Ratios > For Total Capital Ratio Cushion
- OR select Companies (Classic) > Financials
- Deposit Detail > For Uninsured Deposit related fields
- Balance Sheet Ratios > For Basel III Leverage Ratio Cushion

Sustainability
In this release, we expanded the coverage of Sectoral Decarbonization Approach (SDA) for the Paris Alignment dataset to provide temperature alignment across additional scopes of coverage, expanded the baseline and horizon years, and made enhancements to enable point-in-time analysis of the data.Paris Alignment Enhancements
Users can access several key enhancements for Paris Alignment in company pages, Screener, S&P Capital IQ Pro Plug-in, and Dashboard, including the availability of 2023 annual data and a dropdown option with Year and Effective Date for point-in-time analysis. A Scope of Coverage dropdown allows users to view temperature alignment based on different scopes, including Scope 3 - Use of Sold Products, which is specific to the Auto sector for this update. The Sectoral Decarbonization Approach (SDA) is expanded to include additional industries, namely Shipping and Real Estate.
Furthermore, the number of companies covered using the Sectoral Decarbonization Approach increased by approximately 700 across the Electric Utilities, Steel, Cement, Air Transportation, and Aluminum industries. Lastly, the earliest baseline is updated to 2015, and the horizon year is extended to 2035, providing a balanced view of historical and forecasted GHG emissions intensities.
Find it in the platform:
- Search and select a target company in the top search bar
- Navigate to the ESG & Climate section in the left-hand navigation menu
- Select Climate Analytics > Paris Alignment
- Or select Sustainability Coverage List page from the Sustainability menu in the top navigation bar
- In the row for your company of interest, locate the Paris Alignment column and click Yes to navigate to the company’s Paris Alignment page
- Navigate to Screener from the top navigation bar or the Apps menu
- Select Companies view, go to Sustainability category under Browse Criteria on the left
- Navigate to the Sustainability category and select Paris Alignment
- S&P Capital IQ Pro Plug-in:
- In Excel, launch S&P Capital IQ Pro Plug-in and open Formula Builder
- Under Data Items, expand Sustainability > Paris Alignment folder


Portfolio Analytics
In this release, we introduced several new features for Portfolio Analytics users, including the ability to create, save, and share custom text formulas as groupings for improved usability. We added a portfolio comparison mode to compare portfolios side by side. Additionally, we added the ability to rebalance composites annually and new fixed income characteristics. Furthermore, Capital IQ Pro Lists are now supported in Shares Allocator, simplifying the inclusion of custom lists in portfolio construction. Users also have the option to exclude indices without constituent history from portfolio and benchmark search results.Ability to reuse custom text-based formulas as groupings
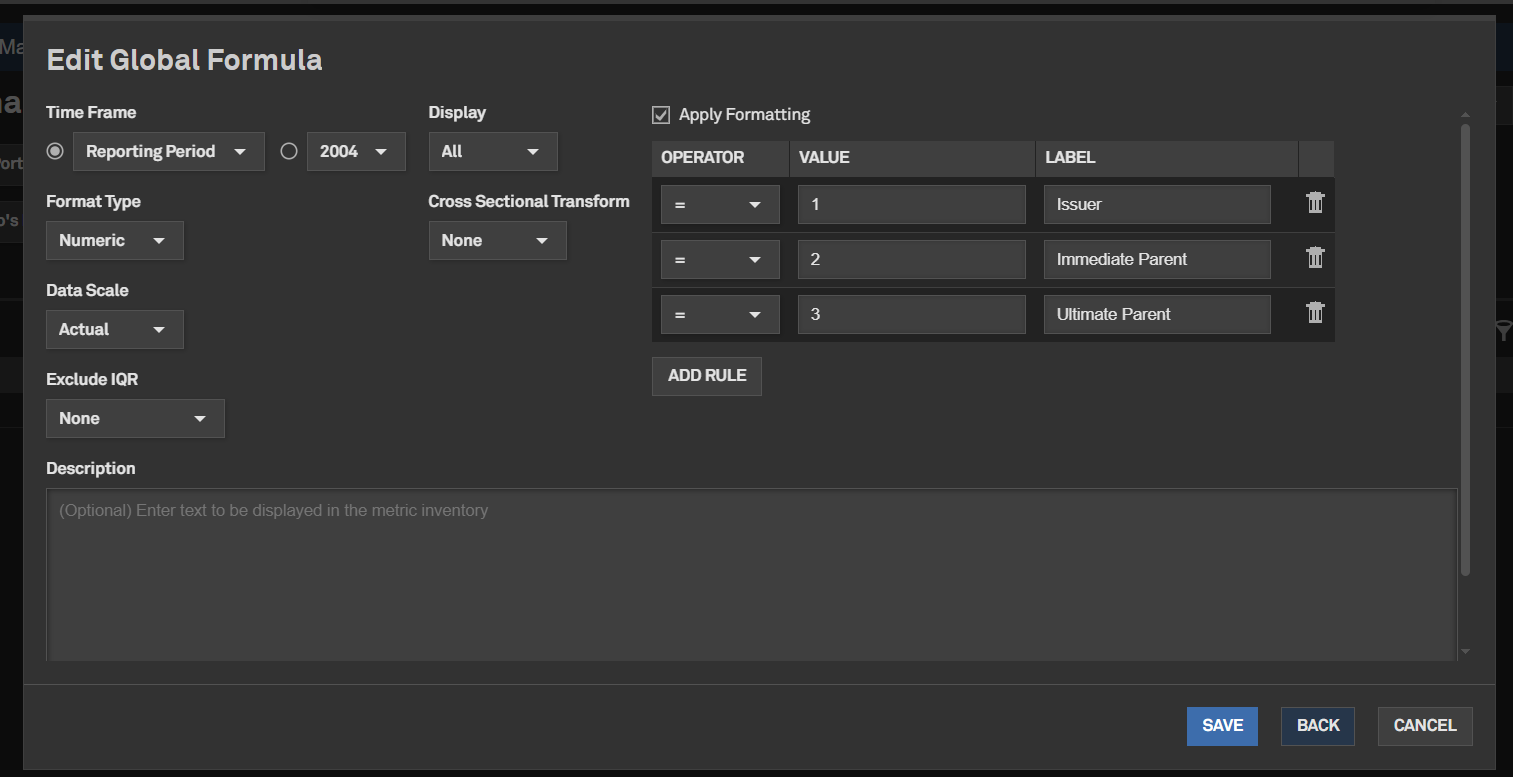
Users can now utilize the text form of a formula to create groupings. After creating a formula that maps numerical output values to a corresponding text for improved readability, the same formula can be applied for groupings.
Find it in the platform:
- Navigate to the Portfolios tab from the top navigation
- Go to Reports and open an existing report or create a new one
- Open a widget in the report and navigate to settings
- Select Add Formula from the top right side of the Data Library
- Create a new formula or edit an existing formula
- At the last step of formula creation, select the Apply Formatting checkbox and map expected formula value ranges to the corresponding text labels and click Save
- Navigate to the widget you wish to apply custom grouping or to the Group by field on the global bar
- Add the recently created formula as a grouping. Share this grouping with others in the firm by sharing the original formula with the same permissions

Scenario Analysis – Portfolio Comparison mode
Users can now use a split-screen function to duplicate a report's content. This enables them to apply different portfolio and benchmark pairs to both the original and replicated sections of the report, enhancing their understanding of how changes in portfolio composition impact tracked metrics and characteristics.
Find it in the platform:
- Navigate to the Portfolios tab from the top navigation
- Go to Reports and open an existing report or create a new one
- Select Portfolio Comparison View from the dropdown arrow next to the report name
- Notice that the report is now split into two identical copies, with the right side blank copy allowing the user to select a different portfolio or benchmark, or both
- Click on Update after selecting the portfolio and benchmark on the right-hand side to view the results
- Note that report content cannot be edited in this mode
- To return to the original report and enable editing, click on Return to Edit Report from the same arrow control

Support for Annual Rebalancing Frequency in Composites
Users can now create or update composites annually, offering enhanced rebalancing capabilities.
Find it in the platform:
- Navigate to the Portfolios tab from the top navigation and select Composites
- On the Composite Dashboard, edit an existing composite or create a new one
- In Rebalancing pulldown, select Annual and click on Save

Support for Capital IQ Pro Lists in Share Allocator
Users can now include lists created in the S&P Capital IQ Pro platform when creating and funding a portfolio via Share Allocator.
Find it in the platform:
- Navigate to the Portfolios tab from the top navigation and select Portfolios
- On the Portfolio Dashboard, create a new portfolio or edit an existing one
- Click on the Shares Allocator button
- Search for a list in Lists/Portfolios/Indices/Funds field
- Click on the Add button
- Choose which of the List constituents to add to the portfolio and click the Next button
Additional Fixed Income Characteristics
Users can now access new fixed-income data for their portfolios.
Find it in the platform:
- Navigate to the Portfolios tab from the top navigation
- Go to Reports and open an existing report or create a new one
- Open a widget in the report and navigate to settings
- Navigate to Portfolio Data > Fixed Income Data folder
- The following metrics are added to the existing list:
- Evaluated Bid Price
- Coupon Interest Frequency
- Accrued Interest
- Convexity
- Maturity Date
- Bond Type

Filtering Index Search Results in Portfolio Selector
When selecting an Index as a portfolio or a benchmark for a report, users can now choose whether to include indices without constituent history in their search results.
Find it in the platform:
- Navigate to the Portfolios tab from the top navigation
- Go to Reports and open an existing report or create a new one
- On the report, select an Index as a Portfolio or a Benchmark
- Choose to include or suppress search results for indices that do not have constituent-level data but do have price or total returns
- To include price or total-level return-only indices in the universe search, select the Include index-level search results checkbox

Mobile App
In this release, we are excited to introduce enhancements to the homepage for Capital IQ Pro mobile app users, making it easier to discover S&P 500 earnings events. We also optimized the homepage for iPad users. Additionally, we added a new native company investment research widget module and page, along with an ownership module, to help our clients quickly access relevant ownership data and analyst research content.Native Corporate Profile Investment Module and Page
The corporate profile investment research widget offers seamless navigation to the native module, featuring customizable filters that allow users to view investment research documents. Users can easily preview and download company-specific research right on their mobile devices.
Find it in the Mobile App:
- Log in to the Capital IQ Pro Mobile App
- Navigate to a public company profile
- Scroll to the Investment Research module
- Tap on View all Investment Research
- To download multiple documents, tap the three dots in the top right corner of the page, select Reports, choose the preferred reports, click Preview, tap the Download icon in the top right corner and select Download Selected

New Earnings Widget
The new earnings widget on the homepage provides a snapshot of S&P 500 companies that have reported their earnings, highlighting the overall trends of misses and beats among the constituents. Additionally, it features daily highlights of companies that are scheduled to announce their earnings or have already done so.
Find it in the Mobile App:
- Log in to the Capital IQ Pro Mobile App
- Scroll to the bottom of the default homepage to access the Earnings widget

New Company Profile Ownership Widget
Capital IQ Pro Mobile App users can access a new ownership widget that offers a snapshot of current ownership data, complemented by a visual chart that illustrates the shares outstanding owned by various types of institutions.
Find it in the Mobile App:
- Log in to the Capital IQ Pro Mobile App
- Navigate to a public company profile page
- Scroll to the Ownership module
Optimized iPad Homepage
We introduced a new homepage layout for iPad users that is optimized to enhance the user experience, featuring an intuitive and more comfortable interface.
Find it in the Mobile App:
- Log in to the Capital IQ Pro Mobile App on an iPad or Android Tablet
- Explore the default homepage

Transactions
In this release, we enhanced the Transactions Summary page to help users easily identify the focus company’s role in transactions. Additionally, we introduced new fields to the Capitalization Table Details page to better analyze private company capitalization.Enhanced Visibility of Company Role in Transactions
Users can now access the enhanced Transactions Summary page, which highlights the focus company and its role in transactions. They can easily analyze why a transaction appears on the page and view highlighted participants related to the focus company and their respective relationships with the focus company.
Find it in the platform:
- Search for and select a company in the top search bar to navigate to its Corporate Profile e.g., S&P Global Inc. (NYSE: SPGI)
- Expand Transactions in the left-hand navigation, open the Transactions Summary page, and navigate to the Details tab
- Expand Filters, open the Include Transactions From filter, and select Subsidiaries from time of acquisition or Subsidiaries for all time
- Find the participants highlighted under the Target, Buyer, or Seller column respectively (either the focus company or its subsidiaries)
- If a subsidiary of the focus company is a participant, click on the adjacent tree icon to view its relationship with the focus company
- Similar information is available on the Detailed M&A History page

Additional Funding Round fields on Capitalization Table Detail
On the Capitalization Table Details page, users can now view additional data fields, including Offer Price and Round Size, to better analyze a private company's capitalization. Additionally, estimated Round Size, Pre- and Post-Money Valuations will be denoted by an ‘E’ for transparency.
Find it in the platform:
- Search for and select a company in the top search bar to navigate to its Corporate Profile e.g., Stripe, Inc.
- Expand Ownership in the left-hand navigation and click the Capitalization Table Details page
- Find additional data fields Offer Price and Round Size

Fixed Income
In this release, we added a new ‘Risk Free Rates’ tab on the Rates & Yield page and relocated 57 interbank rates to the new tab for easy access.Risk Free Rates
Users can now easily find Risk Free Rates on the Rates & Yield page via a new ‘Risk Free Rates’ tab. We also moved 57 Interbank Rates to the new tab.
Find it in the platform:
- Navigate to the Markets tab from the top navigation and select the Rates & Yields page
- Scroll down to All Rates section to access the new tab Risk Free Rates
- Make sure the Rate Type drop-down includes a check box for Risk Free Rates

Expanded Rates & Yields Coverage
Users can now access select swap, reference, and index rates on search, including SONIA, SOFR, and EURIBOR. This enhancement offers comprehensive coverage of these frequently used rates, along with the introduction of forward rates, enhancing benchmarking capabilities with Fixed Income data.
Find it in the platform:
- Navigate to the search bar within the top navigation menu and enter keywords to find any Rates & Yields
- Click on the Advanced Search at the top right of the search results
- On the left-hand navigation, click Markets & Industry Assets > Rates & Yields and filter for Risk Free Rates in the Select Rate Type filter
Fundamentals
In this release, we added new CIQ Fundamentals data items to Screener and the S&P Capital IQ Pro Plug-In.New CIQ Fundamentals Data Items in Screener and the S&P Capital IQ Pro Plug-In
Users can access 50 new Capital IQ Fundamentals data items in Screener and the S&P Capital IQ Pro Plug-In. The new data items include D&A for EBITDA, EBITDA-CAPEX, Auditor Name and Opinion, Inventory Method, Working Capital, and Unusual Items, Total.
Find it in the platform:
- Screener
- Navigate to Screener from the top navigation or from the Apps menu
- Select Companies
- Under Browse Criteria on the left, go to Financials > S&P Capital IQ Fundamentals > Standard Template > Income Statement > Other Income/Expenses
- View the new data item IQ_TOTAL_UNUSUAL, Unusual Items, Total
- Or expand Financials > S&P Capital IQ Fundamentals > Standard Template > Balance Sheet > Supplemental Items
- View the new data items Auditor Name, Auditor Opinion
- S&P Capital IQ Pro Plug-in
- Launch S&P Capital IQ Pro Plug-in in Excel and open Formula Builder
- Under Data Items, expand Financials > S&P Capital IQ Fundamentals > Standard Template > Income Statement > Other Income/Expenses
- Or expand Financials > S&P Capital IQ Fundamentals > Standard Template > Balance Sheet > Supplemental Items

RatingsDirect®
In this release, we enhanced usability and accessibility across RatingsDirect®. Our new S&P Global Ratings Research page is specifically designed for S&P Ratings credit research, making it easier for users to conduct searches and download reports. We also optimized the top-search company information card to display RatingsDirect® specific links, streamlining site navigation.
In Credit Monitor, the ‘Latest Updates’ widget now features Moody’s rating actions and select Key Developments, offering a more comprehensive credit picture across custom lists and sectors. Similarly, we introduced the ‘Average Rating Trend’ widget with adjustable timeframe and debt type inputs, enhancing analytical flexibility.
Furthermore, a new dedicated page for Australian RMBS Arrears & Prepayment Statistics simplifies data exports.
New S&P Global Ratings Research Page
RatingsDirect® users can now access a new S&P Global Ratings Research page featuring a significantly upgraded user interface. This new page is designed for easy keyword search and intuitive filtering, specifically tailored to RatingsDirect® content. Additionally, it includes new columns for page counts and quick PDF download.
Find it in the platform:
- Navigate to the RatingsDirect® menu from the top navigation and select Research Search

RatingsDirect® Links in Typeahead Search
In recent releases, the S&P Capital IQ Pro’s top typeahead search was enhanced with a company information card that displays popular page links for the highlighted search results. With this release, RatingsDirect® users can now see page links tailored to the RatingsDirect® workflow.
Find it in the platform:
- Navigate to the search bar within the top navigation menu of the Capital IQ Pro platform
- Enter keywords for a company name or identifier
- Locate the RatingsDirect® content links in the company information card

Browser Tab Titles for RatingsDirect® Research
When viewing a RatingsDirect® research article, the browser tab title now displays the headline of the open article. This significantly improves navigation for users viewing different articles across multiple tabs simultaneously, as these tabs previously only displayed the generic text ‘CIQ Pro: Research’
Find it in the platform:
- Navigate to the RatingsDirect® menu from the top navigation
- Access any RatingsDirect® research article
- Hover over your browser tab to see the article headline

Moody’s Rating Actions in Credit Monitor
RatingsDirect® users can now access Moody’s rating actions in the Latest Updates widget on Credit Monitor, along with related alerts, providing an even more comprehensive credit picture across a custom list or sector.
Find it in the platform:
- Navigate to the RatingsDirect® menu from the top navigation and select Credit Monitor
- In the Latest Updates widget, select Moody’s under the Type dropdown
- If setting up an alert, click the Alerts toggle
- Select the pencil icon to the right of the Alerts toggle, ensure Moody’s is checked
Note: Access to the Moody’s Ratings requires an additional subscription. Please contact your account team for details.
Key Developments in Credit Monitor
RatingsDirect® users can now view select Key Developments in the Latest Updates widget on Credit Monitor, along with related alerts. The focus is on transactions and potential red flags to highlight possible risks across a custom list or sector.
Find it in the platform:
- Navigate to the RatingsDirect® menu from the top navigation and select Credit Monitor
- In the Latest Updates widget, select Key Developments under the Type dropdown
- If setting up an alert, click the Alerts toggle
- Select the pencil icon to the right of the Alerts toggle, ensure Key Developments is checked

Calculated Average Rating Trend in Credit Monitor
Credit Monitor features a new Calculated Average Rating Trend widget, enabling RatingsDirect® users to analyze movements in the average rating for a list or sector. Rating type, debt type, and timeframe inputs are adjustable. This content was previously only available in the Entity Ratings Transition section of Credit Monitor ribbon, which was limited to a 3-month timeframe.
Find it in the platform:
- Navigate to the RatingsDirect® menu from the top navigation and select Credit Monitor
- Scroll down the page to locate the Average Rating Trend widget
- Note the impact of any inputs in the Calculated Average Rating section of the top ribbon

Export Functionality in Credit Monitor
RatingsDirect® users can now view the Export to Excel button at the top right of the Credit Monitor Entity View and Security View pages.
Find it in the platform:
- Navigate to the RatingsDirect® menu from the top navigation and select Credit Monitor
- Select Entity View or Security View from the left-hand navigation
- Locate Export to Excel at the top-right of the page

New Australian RMBS Arrears and Prepayment Statistics Page
RatingsDirect® users can now access a dedicated data visualization page for Australian RMBS Arrears and Prepayment Statistics. This page streamlines the export of these data tables, eliminating the need for users to manually export data from individual reports.
Find it in the platform:
- Navigate to the RatingsDirect® menu from the top navigation and select Structured Finance from the second column
- In the new menu column, select Australian RMBS (Arrears & Prepayment)
- The export link is located at the top right of the page

List Management
In this release, we introduced a new List dropdown menu on the List Details page, featuring multiple tabs, including My Lists and Shared Lists.List Dropdown Menu on List Details Page
Users can now easily navigate between My Lists and Shared Lists using a new dropdown menu on the List Details page, saving time and improving their ability to manage multiple lists more efficiently. When users initially land on the List Details page, they will see a dropdown displaying their recently used lists, enabling quicker navigation. Once users interact with any of the tabs, the recently used list view will disappear, providing a cleaner and more organized browsing experience.
Find it in the platform:
- Click on the Saved Items icon on the top right of the platform
- Select Lists & Screens > Manage Lists
- On the List Manager page, click on any list to open
- On the List Details page, view the new dropdown next to the Currency dropdown

S&P Capital IQ Pro SDK via Labs
In this release, we introduced Capital IQ Pro Software Development Kit App via Labs to enable users to replicate and automate the data and insights found on the company profile, including market data, financial highlights, corporate details, and environmental, social, and governance scores.
Technical users will benefit from this extension as they can integrate key data points directly into their existing tools via an API request, streamlining the process of extracting insights, reducing manual effort, and enabling faster and more informed decision-making.
Software Development Kit in Labs
Users can click on the code block (</>) for each section—market data, financial highlights, corporate details, and environmental, social, and governance scores—to copy the function and replicate the displayed data.
Find it in the platform:
- Navigate to Labs from the top navigation
- If it's not visible, click Edit on the right side of the navigation and add Labs from the Additional Menu Items and click Save
- When in Labs, select the tile CIQ Pro SDK
Note: Access to the Capital IQ Pro SDK requires an additional subscription. Please contact your account team for details.


May 2025 S&P Capital IQ Pro Release Notes
May 2025 S&P Capital IQ Pro Release Notes
In this release, we added new datasets and tools on Capital IQ Pro designed to enhance your daily workflows:
- New Data Center Research Add-On : We introduced a new premium add-on that offers comprehensive access to our global data center database, industry forecasts, and research produced by 451 Research.
- Expanded Data Center Asset Coverage: We added over 8,500 operational facilities to our Real Estate collection, providing asset names, ownership, and location. Additional metrics like property size and power consumption are available with the premium Data Center Research add-on.
- Enhanced Power Plants Equipment Information: We enhanced our equipment Information for Power Plant units, providing insights into the different types of equipment used within a single power plant unit to generate power.
- U.S. Insurance Statutory Enhancements: Our U.S. Insurance Statutory offering now includes quarterly investment updates, incorporating new exhibits and disclosures for U.S. Insurance companies.
April 2025 S&P Capital IQ Pro Release Notes
April 2025 S&P Capital IQ Pro Release Notes
Read April 2025 S&P Capital IQ Pro Release Notes
In this release, we added new datasets and tools on Capital IQ Pro, designed to enhance our client's daily workflows:
- Visible Alpha Estimates: We introduced Visible Alpha Estimates on S&P Capital IQ Pro and S&P Capital IQ Pro Plug-in, offering comprehensive consensus estimates and historical financials for 7,300+ companies across 170+ industries.
- Enhanced Private Company Data: We expanded coverage for Australian private companies, providing additional firmographics and financials for SMEs in Australia.
- Workflow Efficiencies: We added Headcount Data Grouping functionality in Screener to group data by country/region or primary industry for streamlined analysis and enhanced editing and saving features of investment research Saved Searches.
- ‘Ask AI Help’ Feature: We launched a new feature in Help Menu of S&P Capital IQ Pro to enable users to ask questions, retrieve formulas, navigate Help documentation, and provide feedback easily.
Marketplace Data & Solutions Communiqué
The Marketplace Data & Solutions Communiqué reflects developments in the S&P Global Marketplace, your discovery tool for differentiated data and robust solutions with an integrated support site.Marketplace Data & Solutions Communiqué
Data: Leverage premium fundamental and alternative datasets available seamlessly, along with expert analysis, to accelerate your journey from data to insight.
Solutions: Gain maximum value from your big data with technology solutions designed to enhance your workflow, increase your insights, and complement your datasets. Our solutions, including Snowflake, Kensho NERD, Xpressfeed, Xpressfeed Loader, and API Solutions, help you make the most of all your data.
If you wish to subscribe, sign up on the Communiqué Marketplace site.
