Customer Logins
Obtain the data you need to make the most informed decisions by accessing our extensive portfolio of information, analytics, and expertise. Sign in to the product or service center of your choice.
Customer Logins
ECONOMICS COMMENTARY
May 24, 2019
UK manufacturing surveys: measuring flows and levels

- Question phrasing can be key to explaining survey divergences
- CBI survey seen to lag PMI as surveys differ in monitoring levels and flows
- Subjective gauges can be an additional source of variation in time series
Differences in survey methodology can cause major differences in signals, which should always be borne in mind when analysing business survey data. The precise questionnaire wording is particularly important, as illustrated by two surveys of UK manufacturing.
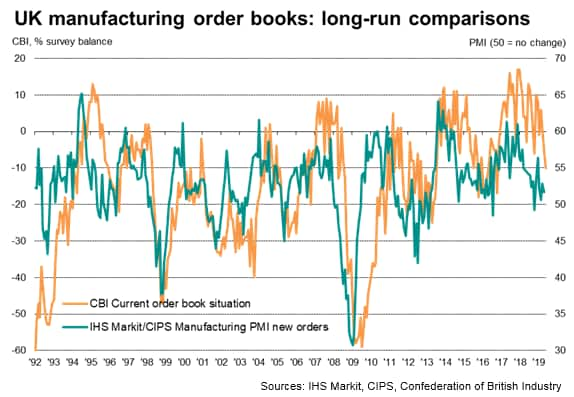
Mixed signals from surveys
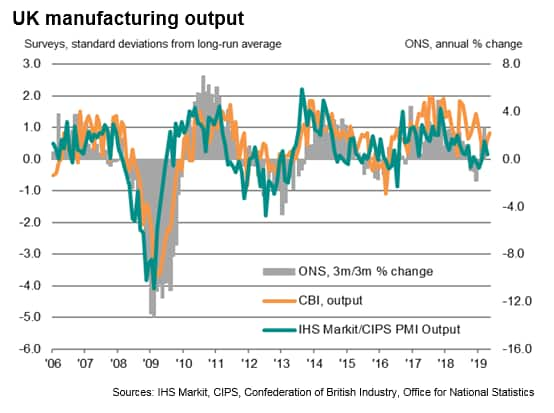
The Confederation of British Industry and IHS Markit/CIPS both publish monthly surveys of manufacturing business conditions, but often diverge in terms of the signals being sent in respect to the trends in output and new orders.
In mid-2018, for example, the CBI survey was indicating one of the fastest periods of manufacturing output growth since 2013, whereas the PMI had slipped into territory indicative of production almost stalling. While the CBI survey continued to indicate solid output growth in the second half of 2018, the PMI remained weak, consistent with falling output in the fourth quarter. In this instance, the PMI proved to have been the more reliable indicator, with official (Office for National Statistics) manufacturing output data showing falling output in the three months to December.
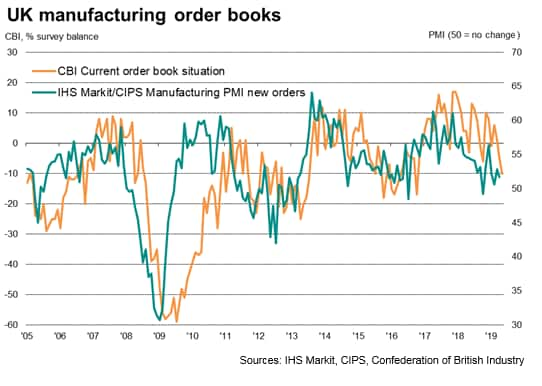
The CBI's order book index was more useful in accurately anticipating the late-2018 downturn, though see-sawed between contraction and growth territory to muddy the picture. By contrast, the downward trend in the PMI was more steady and clear-cut. Moreover, the PMI index turned down earlier than the CBI, having assumed a general downward trend since late-2017. The PMI gauge slipped into contraction in October 2018 to register the worst order book performance since the EU referendum.
Since then, as of May 2019, the CBI's gauge of new orders has now also slipped to its lowest since the EU referendum, though this merely represents catch-up compared to the PMI (data up to April).
To understand why the surveys diverged in late-2018, and why they have now come into line, we need to look at the questions asked.
Flows versus levels
In short, the CBI survey looks at levels relative to a benchmark of 'normal', while the PMI measures the monthly change, or flow. Flows will tend to change first.
The CBI survey asks companies if their order book is normal, above normal or below normal. In contrast, the PMI asks if the volume of new orders has risen, fallen or stayed unchanged on the prior month. Clearly there are instances where inflows of new orders could have fallen for several months but the overall level of orders has remained above normal, and vice versa. In such instances, the PMI will turn before the CBI survey.
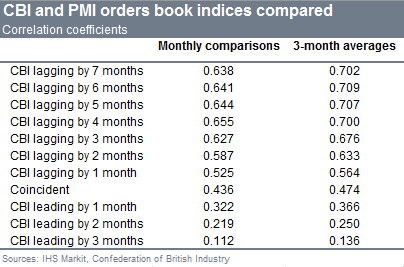
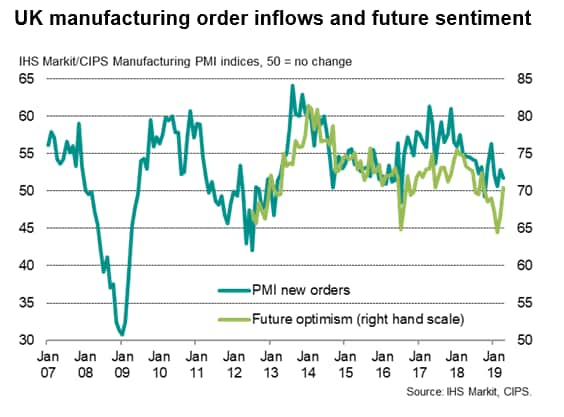
PMI new orders as leading indicator
The leading indicator properties of the PMI can be seen visually when charted against the CBI survey but is further illustrated by simple correlations. We look at the period 1992 (when the PMI commenced) and the end of 2018, comparing the two survey indices in raw monthly format and smoothed three-month averages.
- The highest correlation in the raw data is observed when the CBI is lagged by four months (i.e. the PMI provides a four-month lead indication).
- The highest correlation in the three-month moving average is observed when the CBI is lagged by six months (i.e. the PMI provides a six-month lead indication).
Subjectivity an issue for time series
Subjectivity can create further problems when looking at survey time series data in terms of how benchmarks such as 'normal', 'favourable' or 'satisfactory' are used.
The PMI is designed to avoid any subjectivity in the questions (with the obvious exception of the expected future output question). A comparison of whether new orders received are higher, the same or lower than one ago is based on objective business metrics and no opinion should be involved when responding.
The CBI order book question, on the other hand, asks respondents to compare the current order book situation against the subjective benchmark of 'normal'. There is clearly scope for what is to be considered 'normal' to change over time: evidence in fact suggests that a lower order book situation could be considered 'normal' since the global financial crisis.
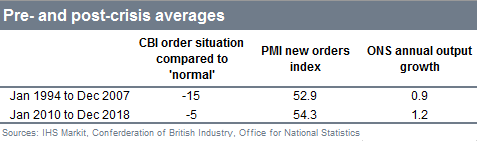
To illustrate, we look at average values of the CBI and PMI survey questions before and after the global financial crisis, and compare against the average rate of growth of manufacturing output as given by the ONS.
In the years leading up to the crisis, the CBI survey net balance averaged -15 compared to -5 in the nine years following the crisis, indicating a major shift in a positive direction since the crisis. One would therefore have expected actual output growth to have been far higher since the financial crisis than before. However, annual output growth has in fact only risen from an average of 0.9% before the crisis to 1.2% since the crisis. This corresponds with the theory about adjusting to a new lower 'normal': there have typically been fewer negative respondents since the crisis because the new vision of what is 'normal' has been set lower.
The PMI survey index, in contrast, has recorded only marginally stronger growth since the financial crisis, corresponding more closely with the actual output data.
In other words, only the subjective CBI survey index has seen a structural shift since the financial crisis, which is in fact visible when the CBI and PMI surveys are charted historically.
It is possible that the post-EU referendum may also have seen a further structural break in sentiment-based survey time series, with the new 'normal' set even lower than in the immediate post-financial crisis years, which is something that should be borne in mind when analysing CBI data. Such a shift should not be evident in the PMI new orders index. This theory is give some weight by a comparison of the objective PMI new orders measure with the subjective PMI question on future output expectations. The data suggest that future expectations have run lower relative to actual new order growth after the referendum. Further work is required to explore this possibility and its implications.
Chris Williamson, Chief Business Economist, IHS
Markit
Tel: +44 207 260 2329
chris.williamson@ihsmarkit.com
© 2019, IHS Markit Inc. All rights reserved. Reproduction in whole
or in part without permission is prohibited.
Purchasing Managers' Index™ (PMI™) data are compiled by IHS Markit for more than 40 economies worldwide. The monthly data are derived from surveys of senior executives at private sector companies, and are available only via subscription. The PMI dataset features a headline number, which indicates the overall health of an economy, and sub-indices, which provide insights into other key economic drivers such as GDP, inflation, exports, capacity utilization, employment and inventories. The PMI data are used by financial and corporate professionals to better understand where economies and markets are headed, and to uncover opportunities.
This article was published by S&P Global Market Intelligence and not by S&P Global Ratings, which is a separately managed division of S&P Global.
{"items" : [
{"name":"share","enabled":true,"desc":"<strong>Share</strong>","mobdesc":"Share","options":[ {"name":"facebook","url":"https://www.facebook.com/sharer.php?u=http%3a%2f%2fwww.spglobal.com%2fmarketintelligence%2fen%2fmi%2fresearch-analysis%2fuk-manufacturing-surveys-measuring-flows-and-levels-240519.html","enabled":true},{"name":"twitter","url":"https://twitter.com/intent/tweet?url=http%3a%2f%2fwww.spglobal.com%2fmarketintelligence%2fen%2fmi%2fresearch-analysis%2fuk-manufacturing-surveys-measuring-flows-and-levels-240519.html&text=UK+manufacturing+surveys%3a+measuring+flows+and+levels+%7c+S%26P+Global+","enabled":true},{"name":"linkedin","url":"https://www.linkedin.com/sharing/share-offsite/?url=http%3a%2f%2fwww.spglobal.com%2fmarketintelligence%2fen%2fmi%2fresearch-analysis%2fuk-manufacturing-surveys-measuring-flows-and-levels-240519.html","enabled":true},{"name":"email","url":"?subject=UK manufacturing surveys: measuring flows and levels | S&P Global &body=http%3a%2f%2fwww.spglobal.com%2fmarketintelligence%2fen%2fmi%2fresearch-analysis%2fuk-manufacturing-surveys-measuring-flows-and-levels-240519.html","enabled":true},{"name":"whatsapp","url":"https://api.whatsapp.com/send?text=UK+manufacturing+surveys%3a+measuring+flows+and+levels+%7c+S%26P+Global+ http%3a%2f%2fwww.spglobal.com%2fmarketintelligence%2fen%2fmi%2fresearch-analysis%2fuk-manufacturing-surveys-measuring-flows-and-levels-240519.html","enabled":true}]}, {"name":"rtt","enabled":true,"mobdesc":"Top"}
]}