Customer Logins
Obtain the data you need to make the most informed decisions by accessing our extensive portfolio of information, analytics, and expertise. Sign in to the product or service center of your choice.
Customer Logins
Sep 20, 2018
Trade Policy Insights: US China - Who is at risk? New Global Trade Rules?
Author: Daniela Stratulativ, Associate Director, Global Trade | Maritime & Trade
Key points:
- New US tariffs on $200 bn Chinese imports of 5,745 products announced on Monday September 17th will take effect on Monday September 24th.
- High volume imports of products affected by new tariffs: furniture, machinery, articles of iron and steel, plastics, plastering materials, vehicles and parts, wood, ceramic and glass products.
- US ports with highest volumes of Chinese imports: Los Angeles, Long Beach, Savannah, Newark.
- New global trade rules have been proposed by European Union on Tuesday September 18th to modernize the World Trade Organization to address market distortions and improve dispute settlement process. EU approach is presented to EU partners in Geneva today September 20th, 2018 during the meeting on the subject convened by Canada.
US New Tariffs
On Monday September 17th, the Office of the United States Trade Representative (USTR) released a list of approximately $200 billion worth of Chinese imports that will be subject to additional tariffs that will take effect September 24th, 2018.
The new tariffs will be imposed on 5,745 products and initially will be in the amount of 10%. Starting January 1, 2019, the level of the additional tariffs will increase to 25%.
Increased prices for imports, due to additional tariffs, could be addressed through an increase in domestic production, use of substitutes, or imports from other trade partners.
EU - World Trade Organization - Proposal for New Trade Rules for the Global Trade System
US China trade relations will be impacted by proposed new global trade rules, being discussed today September 20, 2018 in Geneva.
On September 18th, the European Commission published its ideas for reforming the World Trade Organization. The purpose is to counter market distortions, such as in China, and to discourage the United States from withdrawing from the organization, which is one of the foundations of the modern global economy.
The proposal for modernization of WTO addresses three key areas:
- updating the rule book on international trade to capture today's global economy
- strengthening the monitoring role of the WTO
- overcoming the imminent deadlock on the WTO dispute settlement system.
Today, September 20th, 2018, EU proposal is being presented to EU partners in Geneva, in a meeting convened by Canada.
Products, volumes, and US ports to be affected by the new tariffs
In 2017, US seaborne imports from China reached 68 million tonnes, 10% of US imports volume. The ports with the largest share of Chinese imports are Los Angeles, with 33% share of volume, Long Beach 10%, Newark 10%, Savannah 7%, and Houston 5%.
US Ports by volume of seaborne Imports from China, 2017, all products: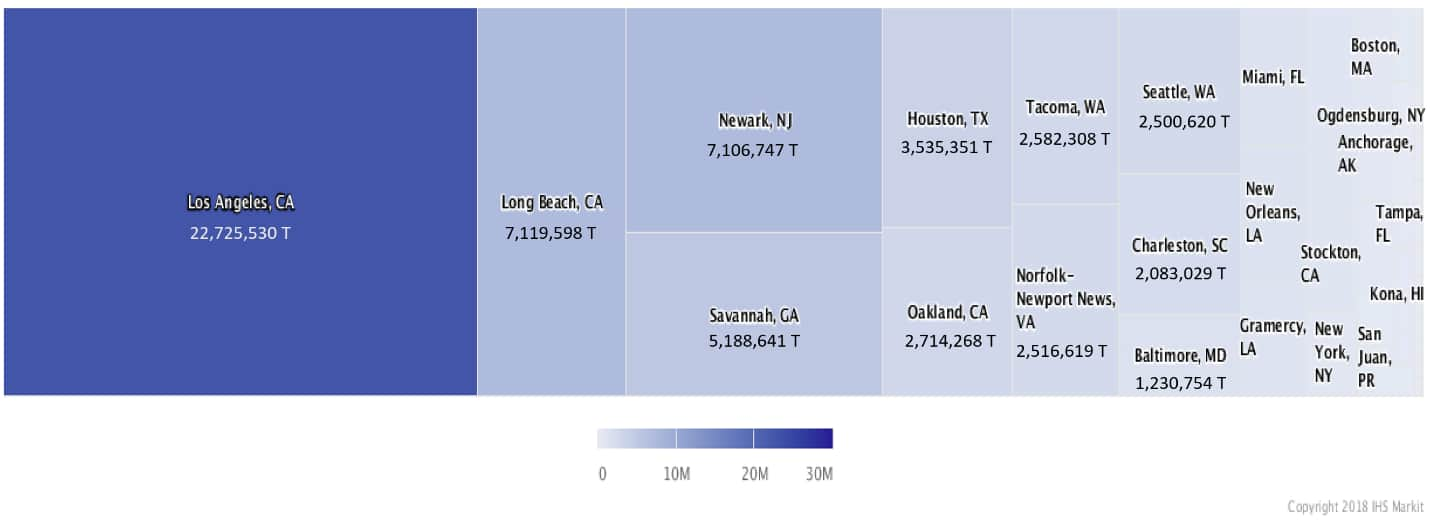
The top 10 seaborne imports by volume subject to new tariffs are products in the following categories: furniture, machinery, articles of iron and steel, plastics, plastering materials, vehicles and parts, wood, ceramic and glass products.
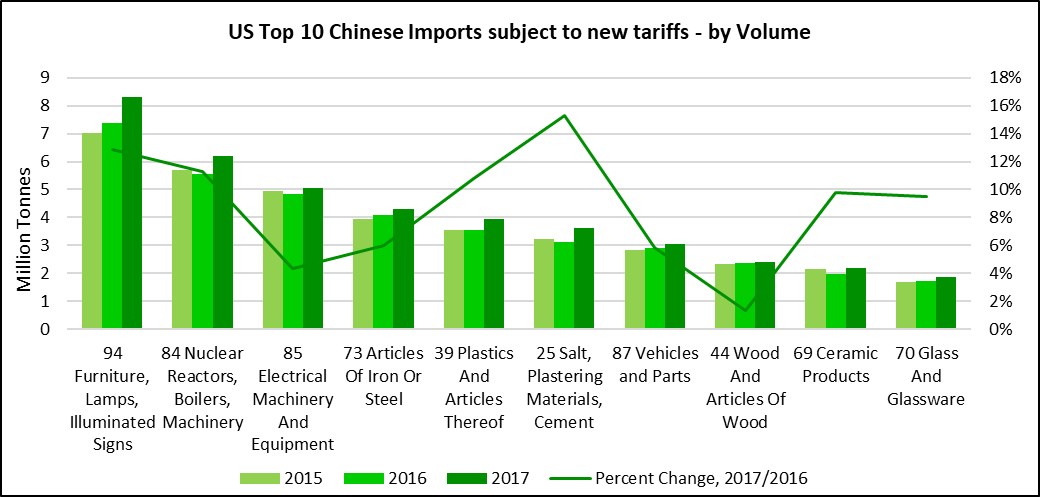
Source: IHS Markit © 2018 IHS Markit
*Products subject to new tariffs in each category can be found in the USTR tariff list.
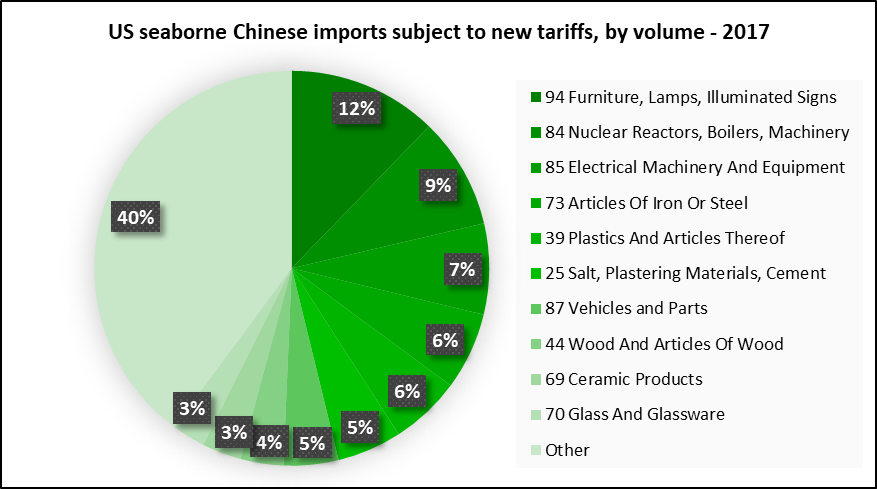
Source: IHS Markit © 2018 IHS Markit
Furniture - seaborne imports:
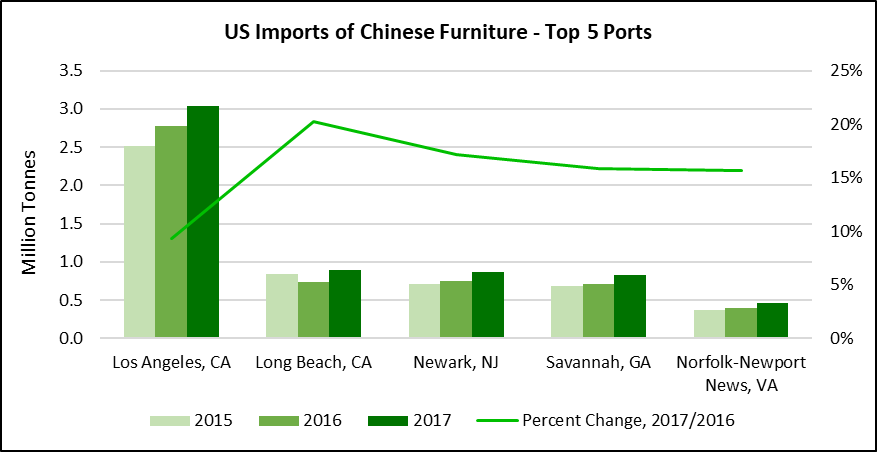
US seaborne imports of Chinese products in the Furniture category in 2017 reached over 8.3 million tonnes, representing 70% of the total US seaborne Furniture imports of 12 million tonnes. Vietnam is the next US supplier by volume, with the share of only 12%, followed by Malaysia with 3.4% share and Taiwan 2.2%.
US Seaborne Furniture Imports 2017 (Tonnes)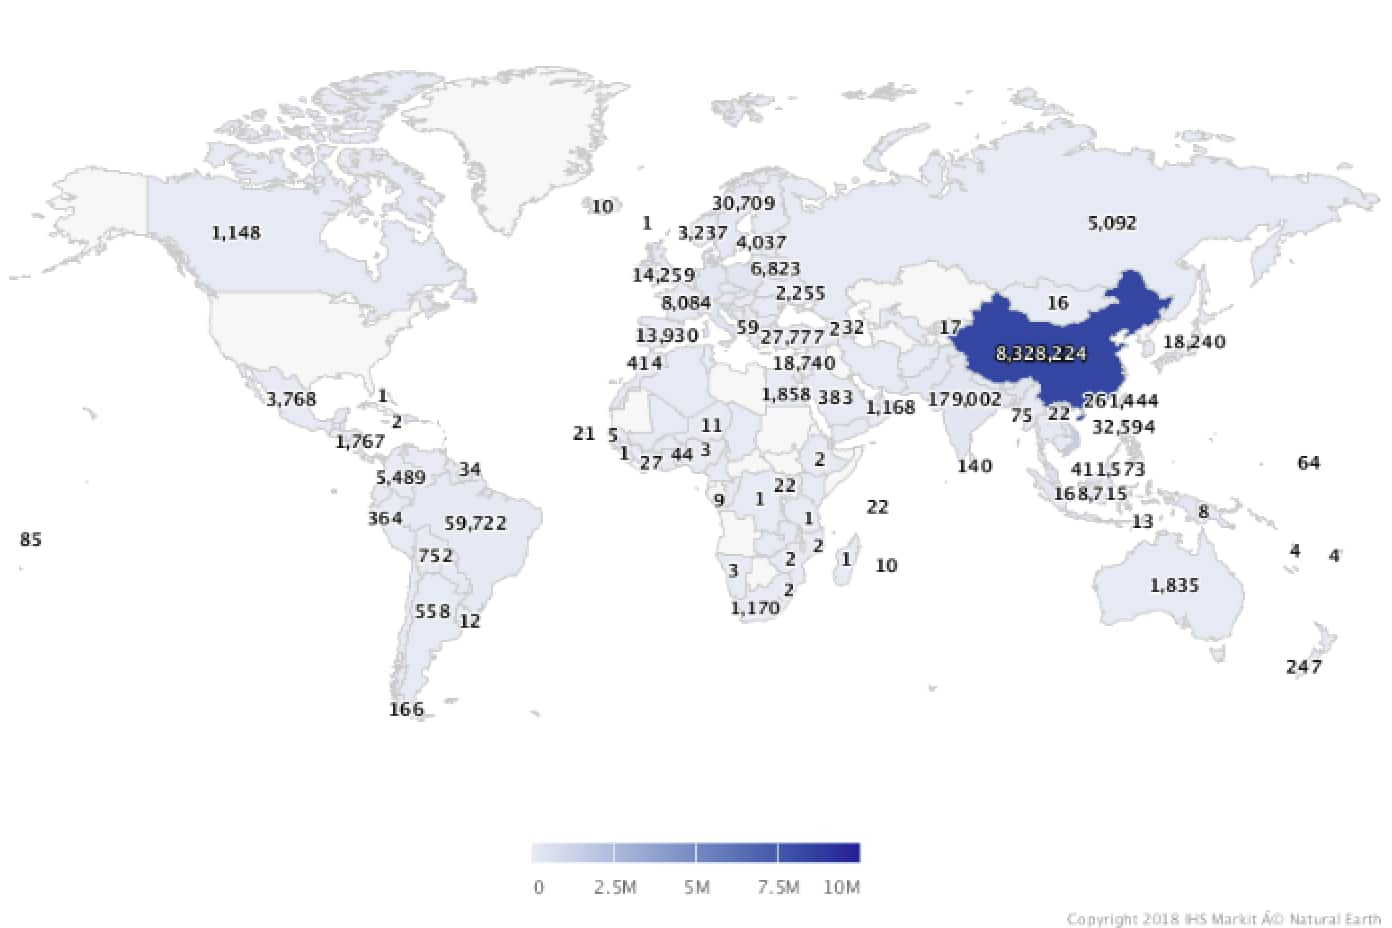
Top 5 US ports for Chinese Furniture products account for 73% of US seaborne Chinese imports in this category.
Source: IHS Markit © 2018 IHS Markit
Machinery - seaborne imports:
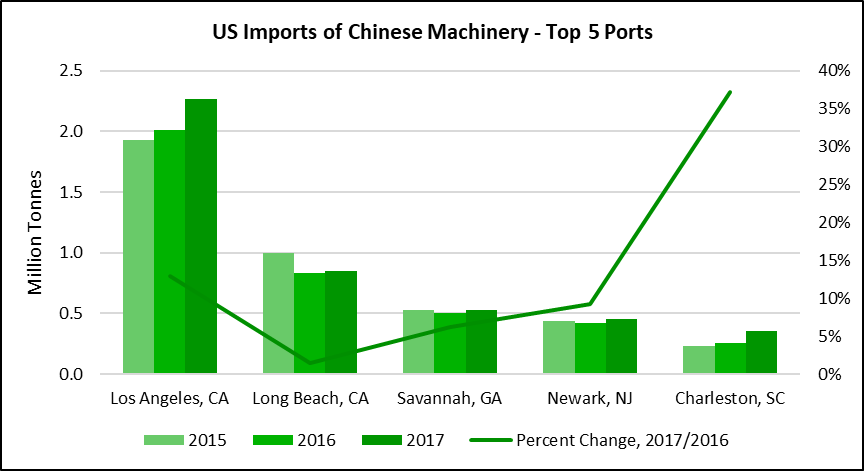
US seaborne imports of Machinery in 2017 totaled 13.3 million tonnes. Imports from China were 6.2 million tonnes and accounted for 46% share of US seaborne imports of Machinery. Imports included products such as air and vacuum pumps, air conditioning machines, parts of machinery, tools amongst others. The other US major suppliers are Japan with 11% share and South Korea with 7%.
US Seaborne Machinery Imports 2017 (Tonnes)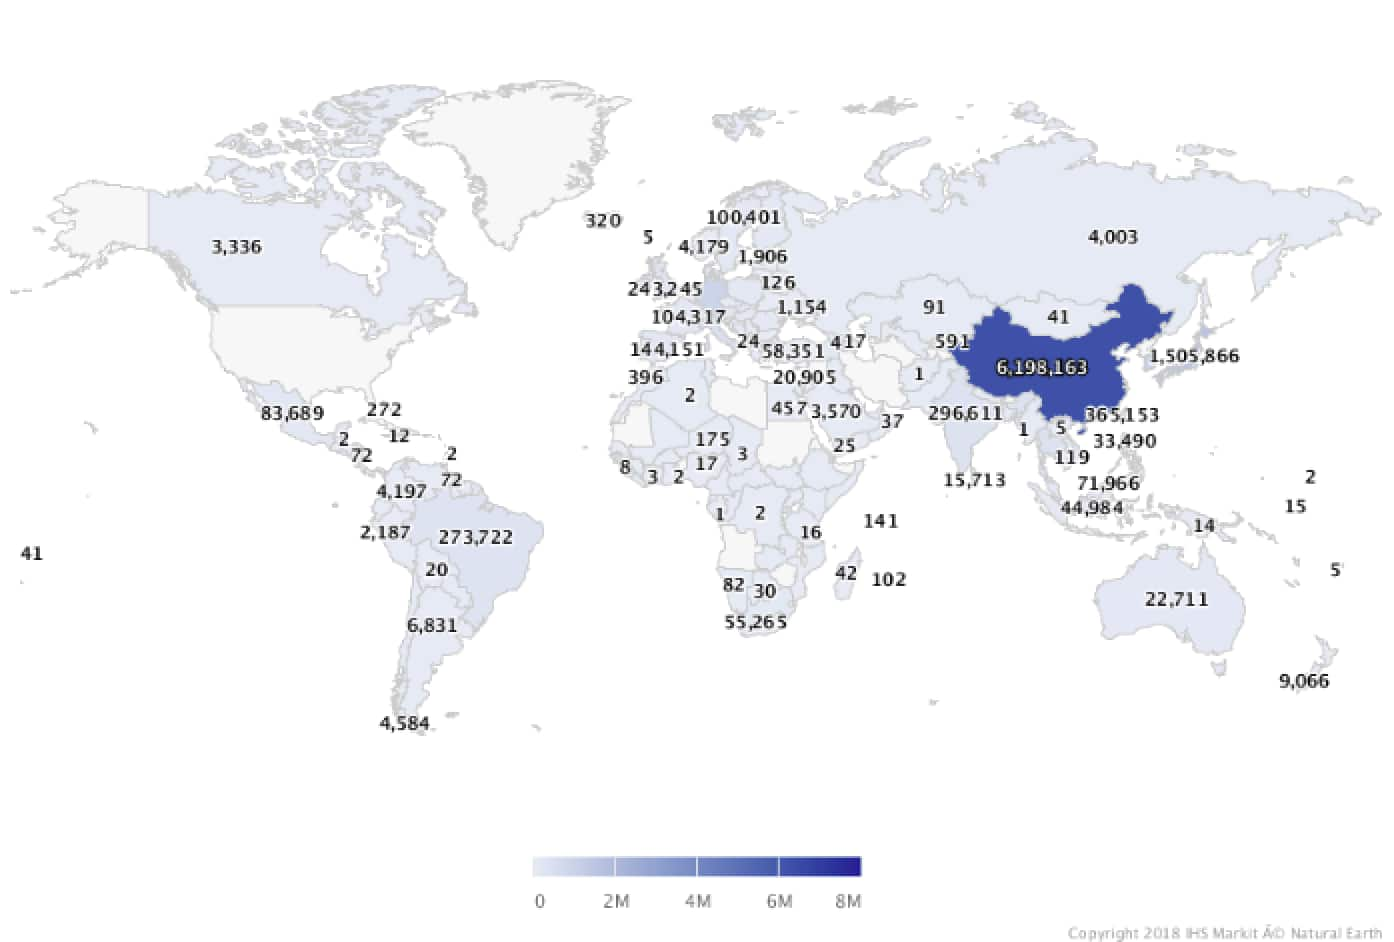
Top 5 US ports for Chinese Machinery products account for 72% of US seaborne Chinese imports in this category.
Source: IHS Markit © 2018 IHS Markit
Electrical Machinery - seaborne imports:
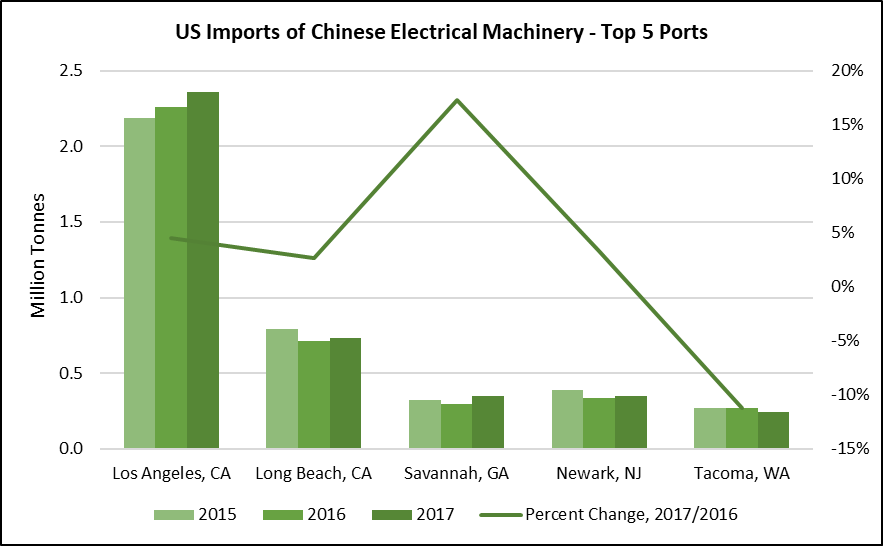
US seaborne imports of Chinese products in the Electrical Machinery category in 2017 reached 5 million tonnes, representing 61% of the total US imports of 8.3 million tonnes in this category. The next US suppliers by volume are South Korea with a share of 5.5%, Malaysia with 5.4% and Japan with 4.3%. Malaysia and Japan exports of Electrical Machinery to US decreased in 2017 by 10.5%, and 3.1% respectively.
US Seaborne Electrical Machinery Imports 2017 (Tonnes)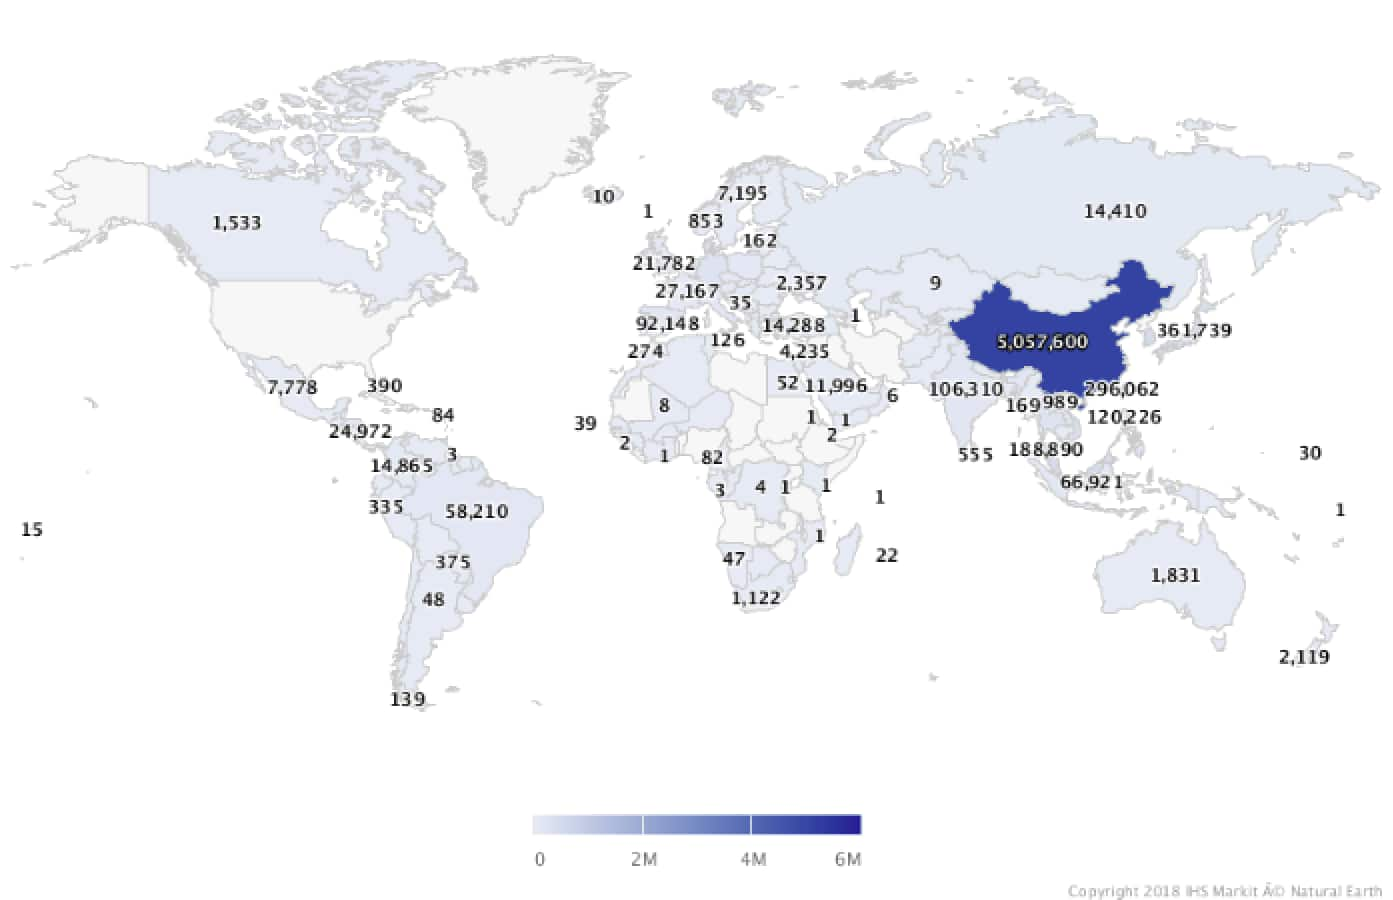
Top 5 US ports for Chinese Electrical Machinery products account for 80% of US seaborne Chinese imports in this category.
Source: IHS Markit © 2018 IHS Markit
Articles of Iron and Steel - seaborne imports:
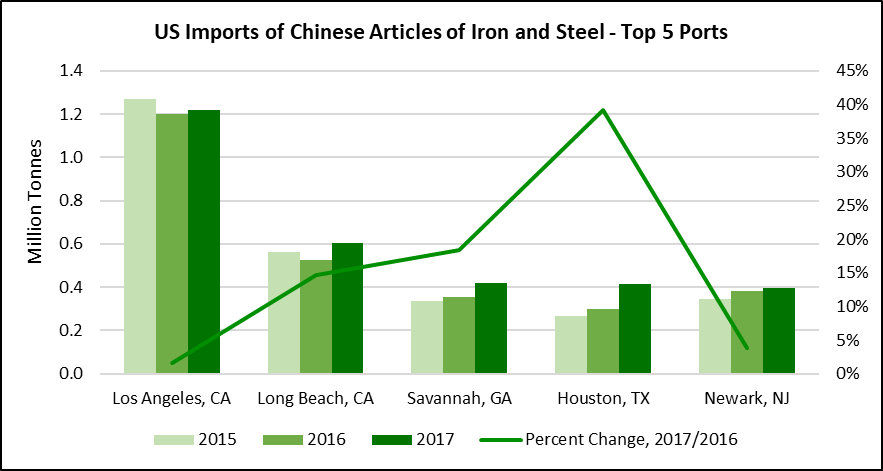
US seaborne imports of Chinese Articles of Iron and Steel in 2017 reached 4.3 million tonnes, representing 32% of the total US seaborne imports of 13.7 million tonnes in this category. The next major suppliers are South Korea with share of 17%, Taiwan 8%, and India 7%.
US Seaborne Articles of Iron and Steel Imports 2017(Tonnes)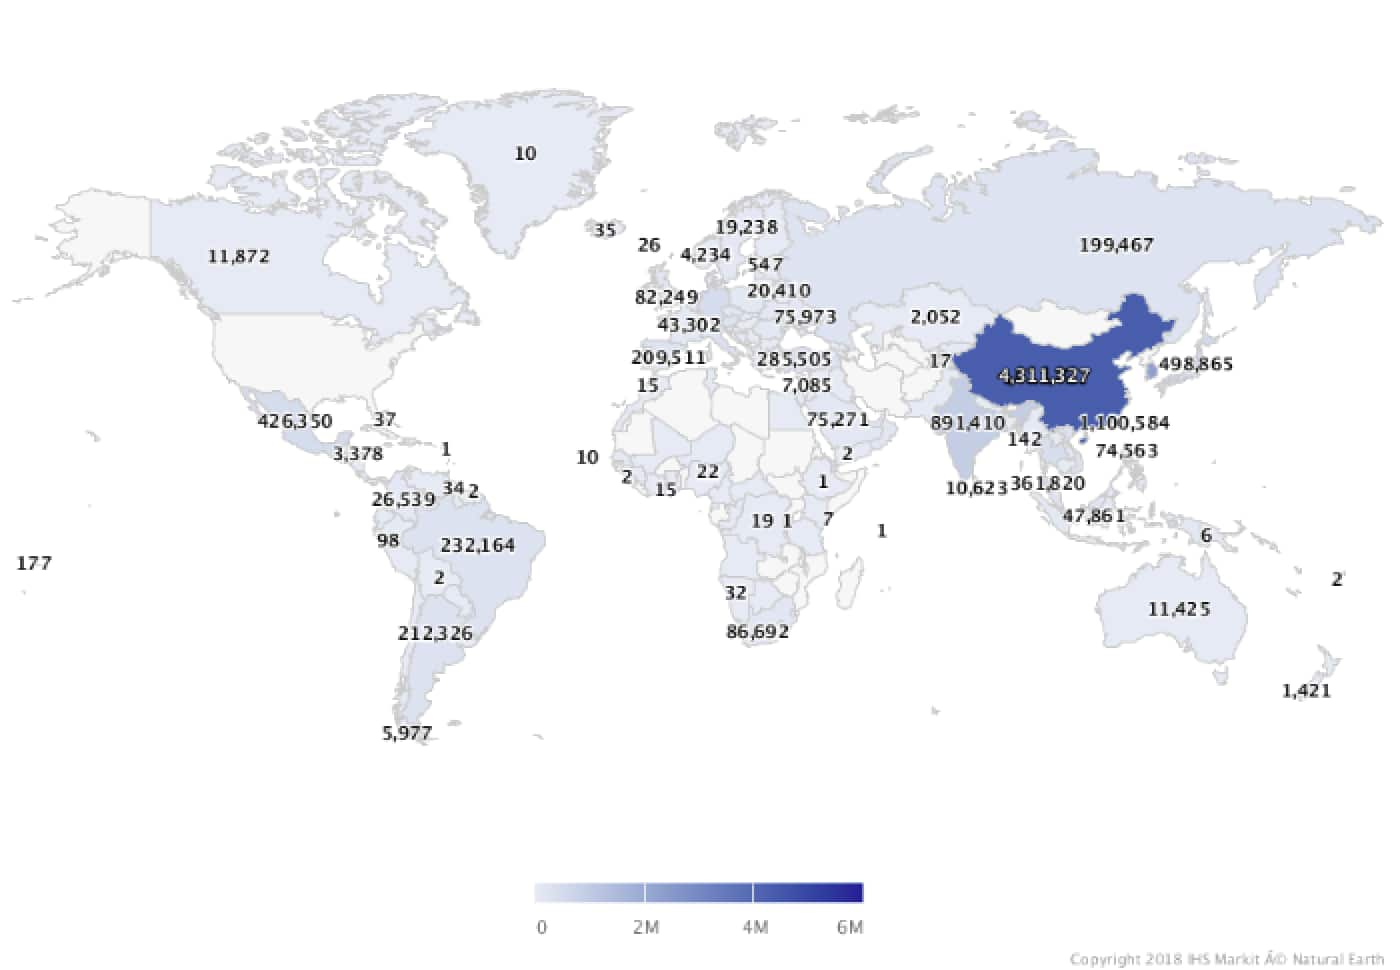
Top 5 US ports for Chinese Articles of Iron and Steel account for 71% of US seaborne Chinese imports in this category.
Source: IHS Markit © 2018 IHS Markit
Plastics - seaborne imports:
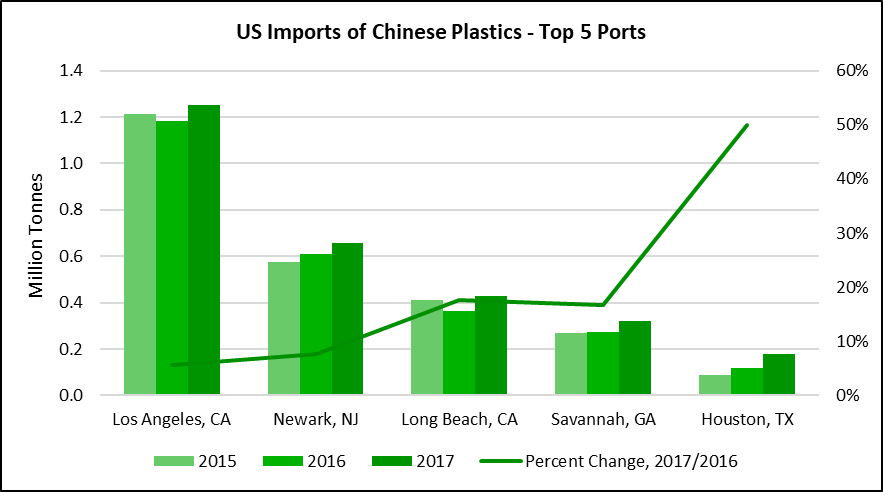
US seaborne imports of Chinese products in the Plastics category in 2017 reached 3.9 million tonnes, representing 42% of the total US seaborne Plastics imports of 9.4 million tonnes. The other US suppliers are South Korea and Taiwan with 7% share each, Germany 6%, Japan and Brazil 3%, followed by trade partners with less than 3% share.
US Seaborne Plastics Imports 2017 (Tonnes)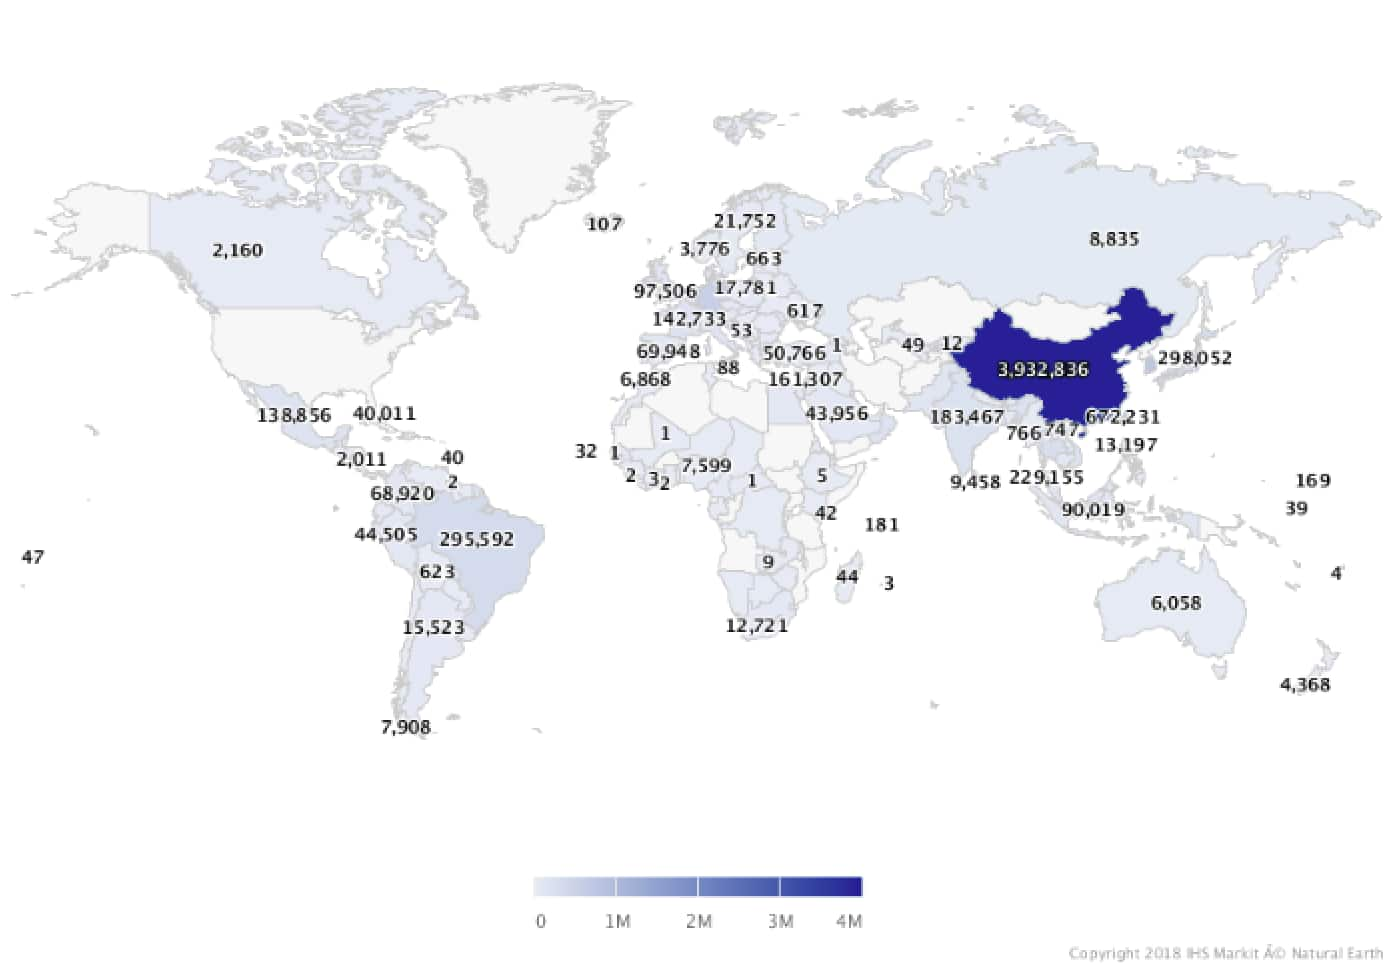
Top 5 US ports for Chinese Plastics products account for 72% of US seaborne Chinese imports in this category.
Source: IHS Markit © 2018 IHS Markit
Research based on value and volumes of product:
94 Furniture; Bedding, Cushions Etc.; Lamps And Lighting Fittings Nesoi; Illuminated Signs, Nameplates And The Like; Prefabricated Buildings referenced in the article as 'Furniture'.
84 Nuclear Reactors, Boilers, Machinery And Mechanical Appliances; Parts Thereof referenced in the article as 'Machinery'.
85 Electrical Machinery And Equipment And Parts Thereof; Sound Recorders And Reproducers, Television Recorders And Reproducers, Parts And Accessories referenced in the article as 'Electrical Machinery'.
73 Articles Of Iron Or Steel
39 Plastics And Articles Thereof referenced in the article as 'Plastics'.
25 Salt; Sulfur; Earths And Stone; Plastering Materials, Lime And Cement referenced in the article as 'Plastering Materials'.
87 Vehicles, Other Than Railway Or Tramway Rolling Stock, And Parts And Accessories Thereof referenced in the article as 'Vehicles and parts'.
44 Wood And Articles Of Wood; Wood Charcoal referenced in the article as 'Wood'.
69 Ceramic Products
70 Glass And Glassware
This column is based on data from IHS Markit Global Trade Atlas (GTA).
Risks, opportunities, impact on supply chains and shipping industry can be identified for all 5745 products at 6-digit code level within GTA. Insights can be complemented with bill of lading data from PIERS and vessel movements via AIS.
We provide The New Intelligence for strategic decision-making to over 50,000 customers in 140 countries - Governments and private sector, including 80% of Global Fortune 500 companies.
{"items" : [
{"name":"share","enabled":true,"desc":"<strong>Share</strong>","mobdesc":"Share","options":[ {"name":"facebook","url":"https://www.facebook.com/sharer.php?u=http%3a%2f%2fwww.spglobal.com%2fmarketintelligence%2fen%2fmi%2fresearch-analysis%2ftrade-policy-insights-us-china-who-is-at-risk-new-global-trade.html","enabled":true},{"name":"twitter","url":"https://twitter.com/intent/tweet?url=http%3a%2f%2fwww.spglobal.com%2fmarketintelligence%2fen%2fmi%2fresearch-analysis%2ftrade-policy-insights-us-china-who-is-at-risk-new-global-trade.html&text=Trade+Policy+Insights%3a+US+China+-+Who+is+at+risk%3f+New+Global+Trade+Rules%3f+%7c+S%26P+Global+","enabled":true},{"name":"linkedin","url":"https://www.linkedin.com/sharing/share-offsite/?url=http%3a%2f%2fwww.spglobal.com%2fmarketintelligence%2fen%2fmi%2fresearch-analysis%2ftrade-policy-insights-us-china-who-is-at-risk-new-global-trade.html","enabled":true},{"name":"email","url":"?subject=Trade Policy Insights: US China - Who is at risk? New Global Trade Rules? | S&P Global &body=http%3a%2f%2fwww.spglobal.com%2fmarketintelligence%2fen%2fmi%2fresearch-analysis%2ftrade-policy-insights-us-china-who-is-at-risk-new-global-trade.html","enabled":true},{"name":"whatsapp","url":"https://api.whatsapp.com/send?text=Trade+Policy+Insights%3a+US+China+-+Who+is+at+risk%3f+New+Global+Trade+Rules%3f+%7c+S%26P+Global+ http%3a%2f%2fwww.spglobal.com%2fmarketintelligence%2fen%2fmi%2fresearch-analysis%2ftrade-policy-insights-us-china-who-is-at-risk-new-global-trade.html","enabled":true}]}, {"name":"rtt","enabled":true,"mobdesc":"Top"}
]}


