Customer Logins
Obtain the data you need to make the most informed decisions by accessing our extensive portfolio of information, analytics, and expertise. Sign in to the product or service center of your choice.
Customer Logins
EQUITIES COMMENTARY
Nov 05, 2020
Securities Finance: October 2020 Snapshot
- October revenues decline by 19% YoY, increase by 10% MoM
- European equity revenue rebound intact, revenues increase 17% YoY
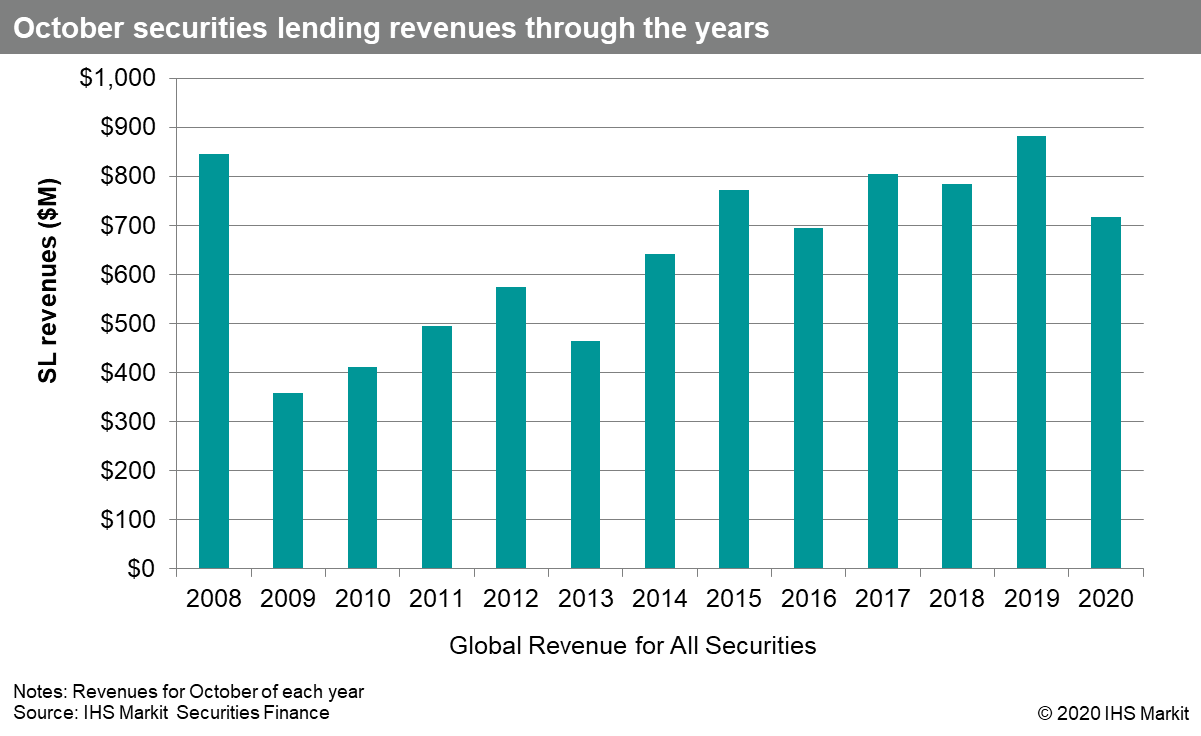
- Lowest October revenue since 2016
- ETF revenues increase 48% YoY
Global securities lending returns declined by 19% YoY in October, however the $717m in revenue did reflect a 10% increase compared with September. The YoY shortfall was primarily driven by Americas and Asia equities; The US equity market continues to fall short of a stellar 2019, however the revenue trend is upward, while Asia equity returns are still trending down. European equity revenues remain elevated as the result of hard-to-borrow shares which started in Q3, however a challenging Q2 still weighs on YTD returns.
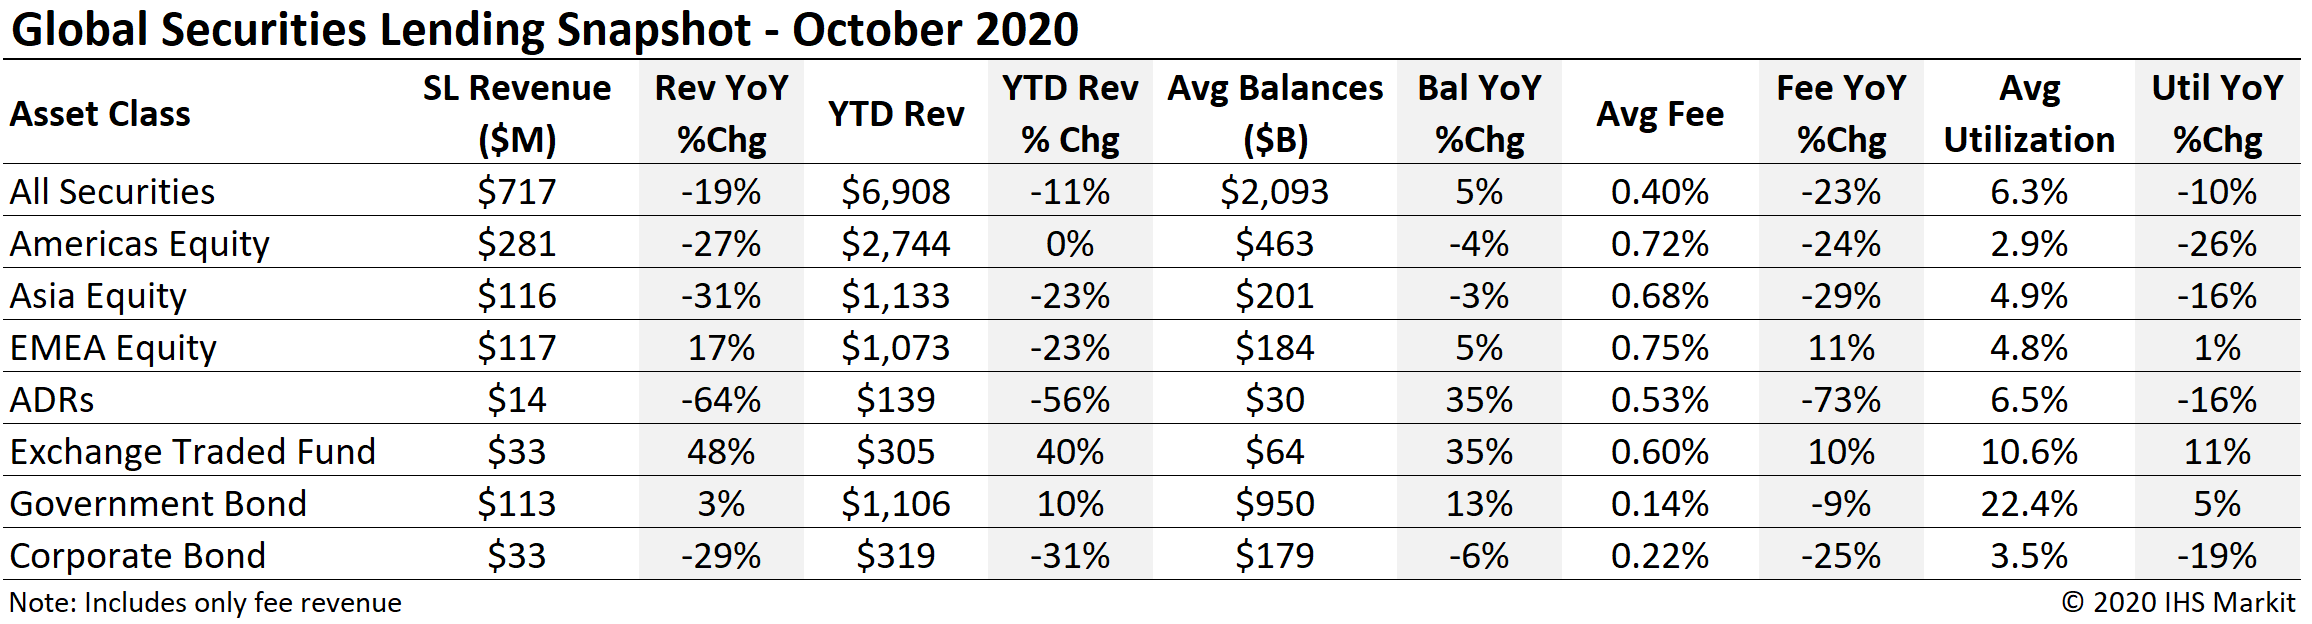
Revenue drivers which emerged toward the end of September persisted and expanded in October. Those trends include increasing capital raises both for distressed enterprises as well as initial public offerings and directional short demand relating COVID-19 and its global repercusions. While equity lending revenues have benefitted substantially from corporate actions, and the event-driven fund managers who trade them, a new trend may have emerged in October which could set the stage for broader equity short demand over the last two months of 2020, which we'll discuss later in this note.
European equity revenue increased 17% YoY for October, following a strong Q3 result where revenues increased by 10% YoY. The European upswing continues to be concentrated in Germany and the Netherlands, with the rest of Europe combining for a 12% YoY decline in October. German equity lending revenue were bolstered by hard to borrow shares, with 3 of the top 5 revenue generators in the region listed there. Varta Ag delivered $16m in October revenue, the 3rd consecutive month that the German battery maker was the top revenue generating security globally. German equity lending revenues totalled $31.6m for October, a 104% YoY increase and a 4% MoM increase.
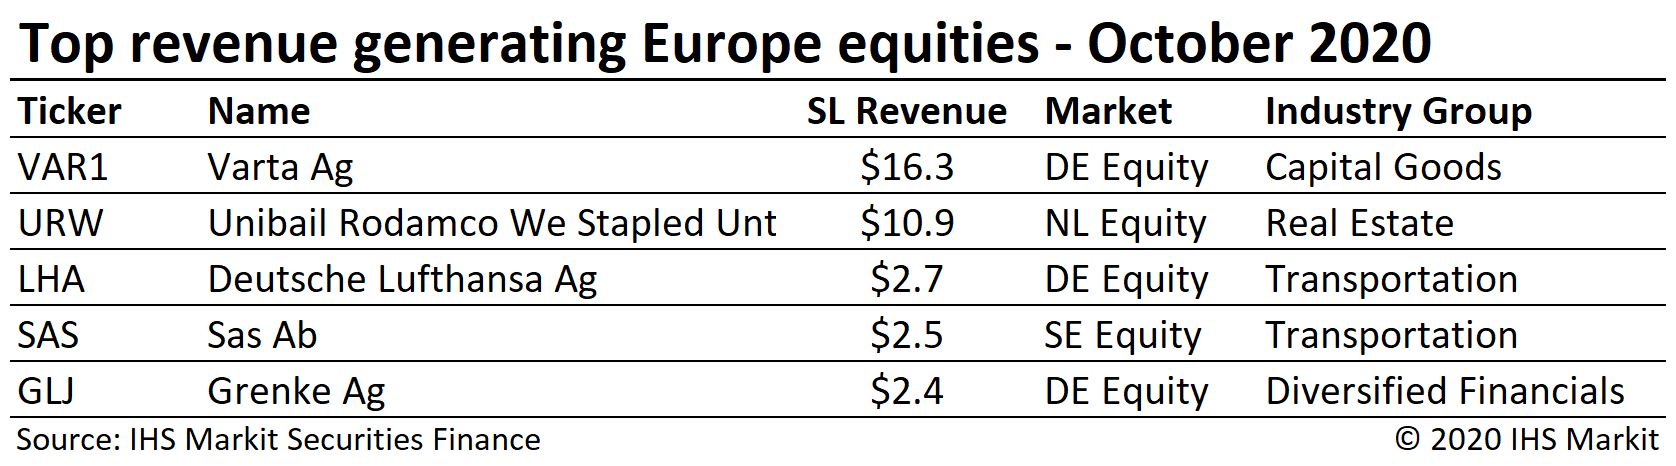
Rights issues continue to drive borrow demand for European equities, with Danish airline SAS AB being the most recent to see soaring borrow cost for common shares as arbitrageurs pay a steep price for hedges. Dutch firm Unibail Rodamco Westfield Se was the 2nd most revenue generating European equity for the 2nd consecutive month, with increasing fees offsetting a decline in shares on loan. On a related note, Italian firm BPER Banca (BPE) generated just over $3m in October revenue as the result of a capital raise required to purchase assets from Intesa Sanpaolo SpA. The increase in revenue from BPE shares boosted October Italy equity lending revenues by 21% YoY, the only month of 2020 where revenues increased compared with 2019.
UK equity lending revenues remain subdued relative to 2019, with $12.2m in October revenue reflecting a 10% YoY decline. French and Spanish equity revenues have also lagged YoY, with October revenues declining 51% and 44%, respectively. YTD European equity lending revenues total $1.1bn, a decline of 23%, however it's worth noting that each month starting with July has seen revenue increase YoY.
Americas equity revenues came in at $281m for October, a 27% YoY decline. As noted in the September snapshot, the YoY comparison suffers from a particularly strong return in 2019; October revenues increased by 25% compared with September with the uptrend from the August doldrums remaining in place.
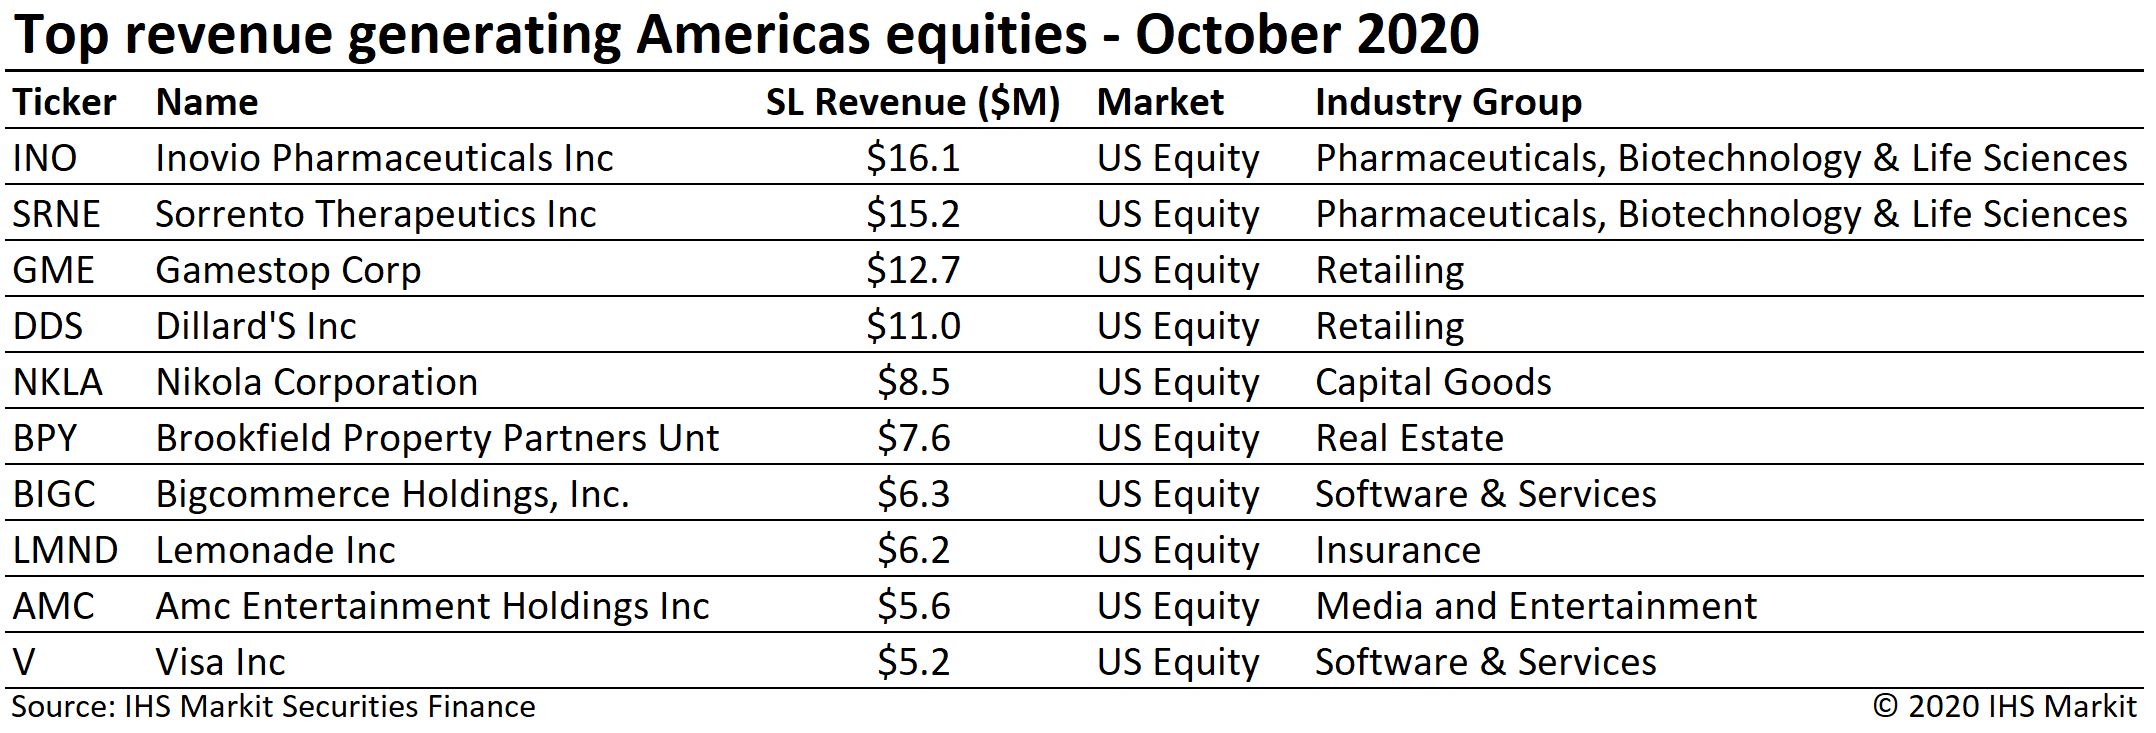
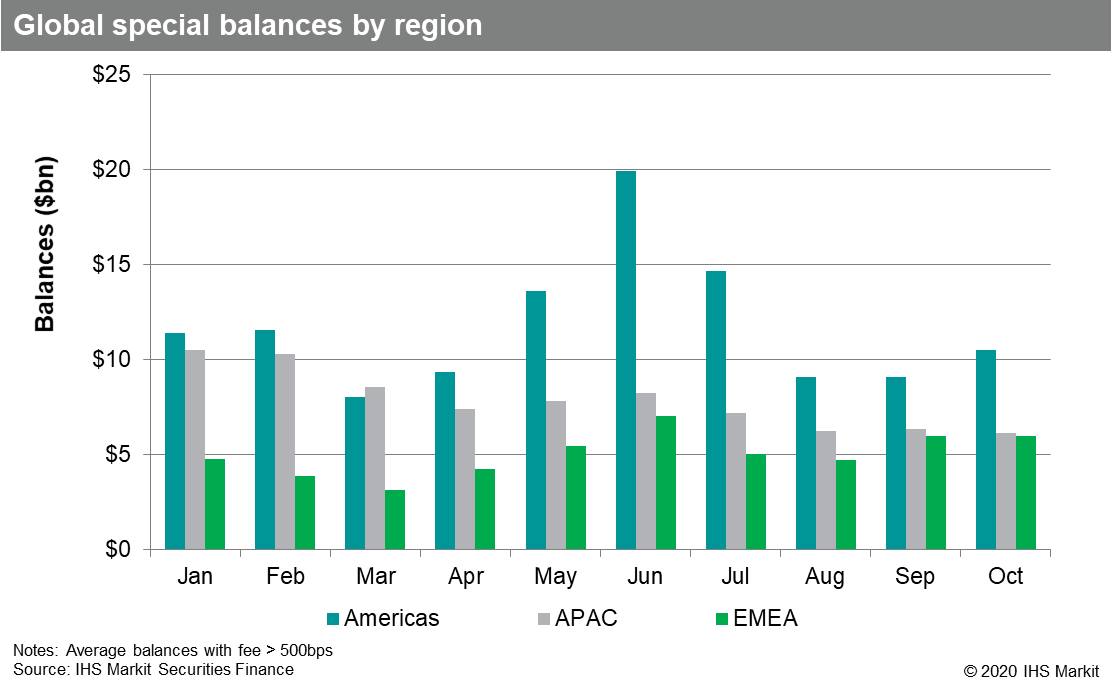
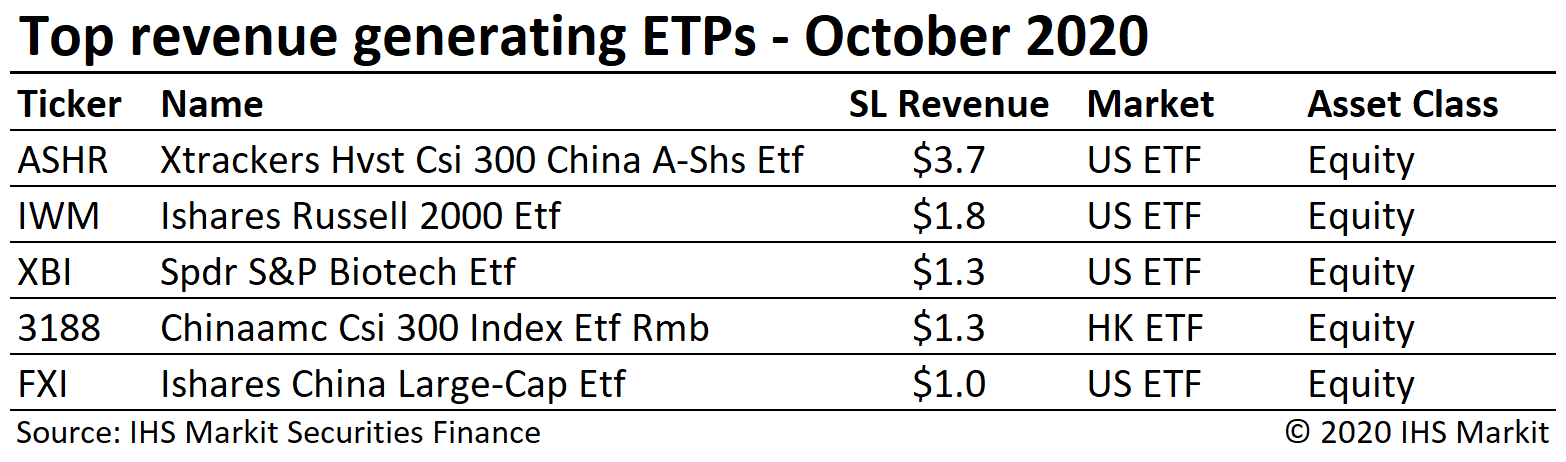
US equity revenues came in at $259m, a 21% YoY decline and 30% MoM increase. The surge in returns one year ago was led by Beyond Meat (BYND), which generated $59m in October 2019 revenues, however US equity revenues would have still declined by 4% YoY excluding the impact of BYND shares. A few examples of 2020 vintage IPOs generating outstanding returns include BigCommerce Holdings, Inc. and Lemonade Inc, which generated $6.3m and $6.2m in October revenue, respectively. With further conventional and SPAC IPOs on deck, notably including the long-awaited Airbnb listing, it's likely that US equity returns maintain the current uptrend through the latter two months of Q4. The two most revenue generating US equities, INO & SRNE, are both related to the COVID-19 vaccine and treatment pipelines, a trend of borrow demand likely to persist for the duration of virus impact. US equity "special" balances, defined here as loans with fee greater than 500bps, increased from an average of $8.2bn in September to $9.8bn in October (remaining well below the $18bn YTD peak observed in June).
Canadian equity lending returns declined sequentially and YoY for October, as was the case for September. The $22.4m in October revenue is the lowest for any month YTD. Cannabis related returns have declined steadily as increased issuance has translated to additional lendable shares and lower fees, with no representation from Canadian equities among the monthly top 10 North America equity revenue generators table for the first time YTD. Canadian equity specials balances have declined from an average of $2bn in January down to only $667m in October.
Asia equity lending revenues continue to fall short of 2019, with October revenues of $116m reflecting a 31% YoY decline, and the lowest monthly return YTD. The largest market, Japan equities, delivered $55m in October revenues, a decline of 26% YoY. Hong Kong equity lending revenues mounted a modest recovery in October, with $25.5m in revenues reflecting a 9% YoY and a 12% MoM increase. The short sale ban in South Korea continues to limit lending revenue, with $9.5m in October revenue being the lowest for any month of 2020.
Global ETP revenues were $33m for October, a 48% YoY increase, however the YoY comparison is partly owing to a dip in October 2019, with the MoM increase only 7% compared with September. On-loan balances averaged $64bn, a 9% MoM increase though still well below the peak monthly average balance of $73bn observed in March. Global ETP utilization increased slightly MoM in October, with the growth in loan balances exceeding a 1.3% increase in lendable asset value. In the September revenue note we pointed out the increased borrow demand for high-yield credit focused funds; The demand for HY products subsided in early October before picking up toward the end of the month in advance of the US election. The increase in demand for HY products didn't have as significant impact on total revenues as they did in the Q1 market decline, however the contribution of fixed income ETPs did increase from 13% in Q3 to 15% in October.
bond lending revenues have been on a steady decline since the post-GFC peak in 2018. Central bank support for global credit has dampened borrow demand while lendable value has increased steadily since April, however October did see a 3% increase in loan balances, which pushed utilization slightly higher MoM. Despite the widening of the HY CDX index over the last three weeks of October, revenues from USD HY corporate bonds continue to decline.
Government bond lending activity has substantially returned to pre-COVID levels in terms of spread and reinvestment revenue. Global government debt lending revenues totalled $113m in October, a 3% YoY increase. Average spreads for government debt stabilized in October, the first month since April to have a MoM increase in average fees. Fee-based revenue for lending US government securities came in at $39m for October, a 4% YoY increase. Returns from lending European sovereigns were $39m for September, a 4% YoY increase.
Conclusion:
The takeaway from the September snapshot was a remarkable similarity to the limited returns in August, albeit with drivers emerging which appeared likely to boost returns in Q4. October revenues did increase 10% MoM, and while they fell short of the 2019 comparable, the event-driven demand for hard-to-borrow shares remains in place.
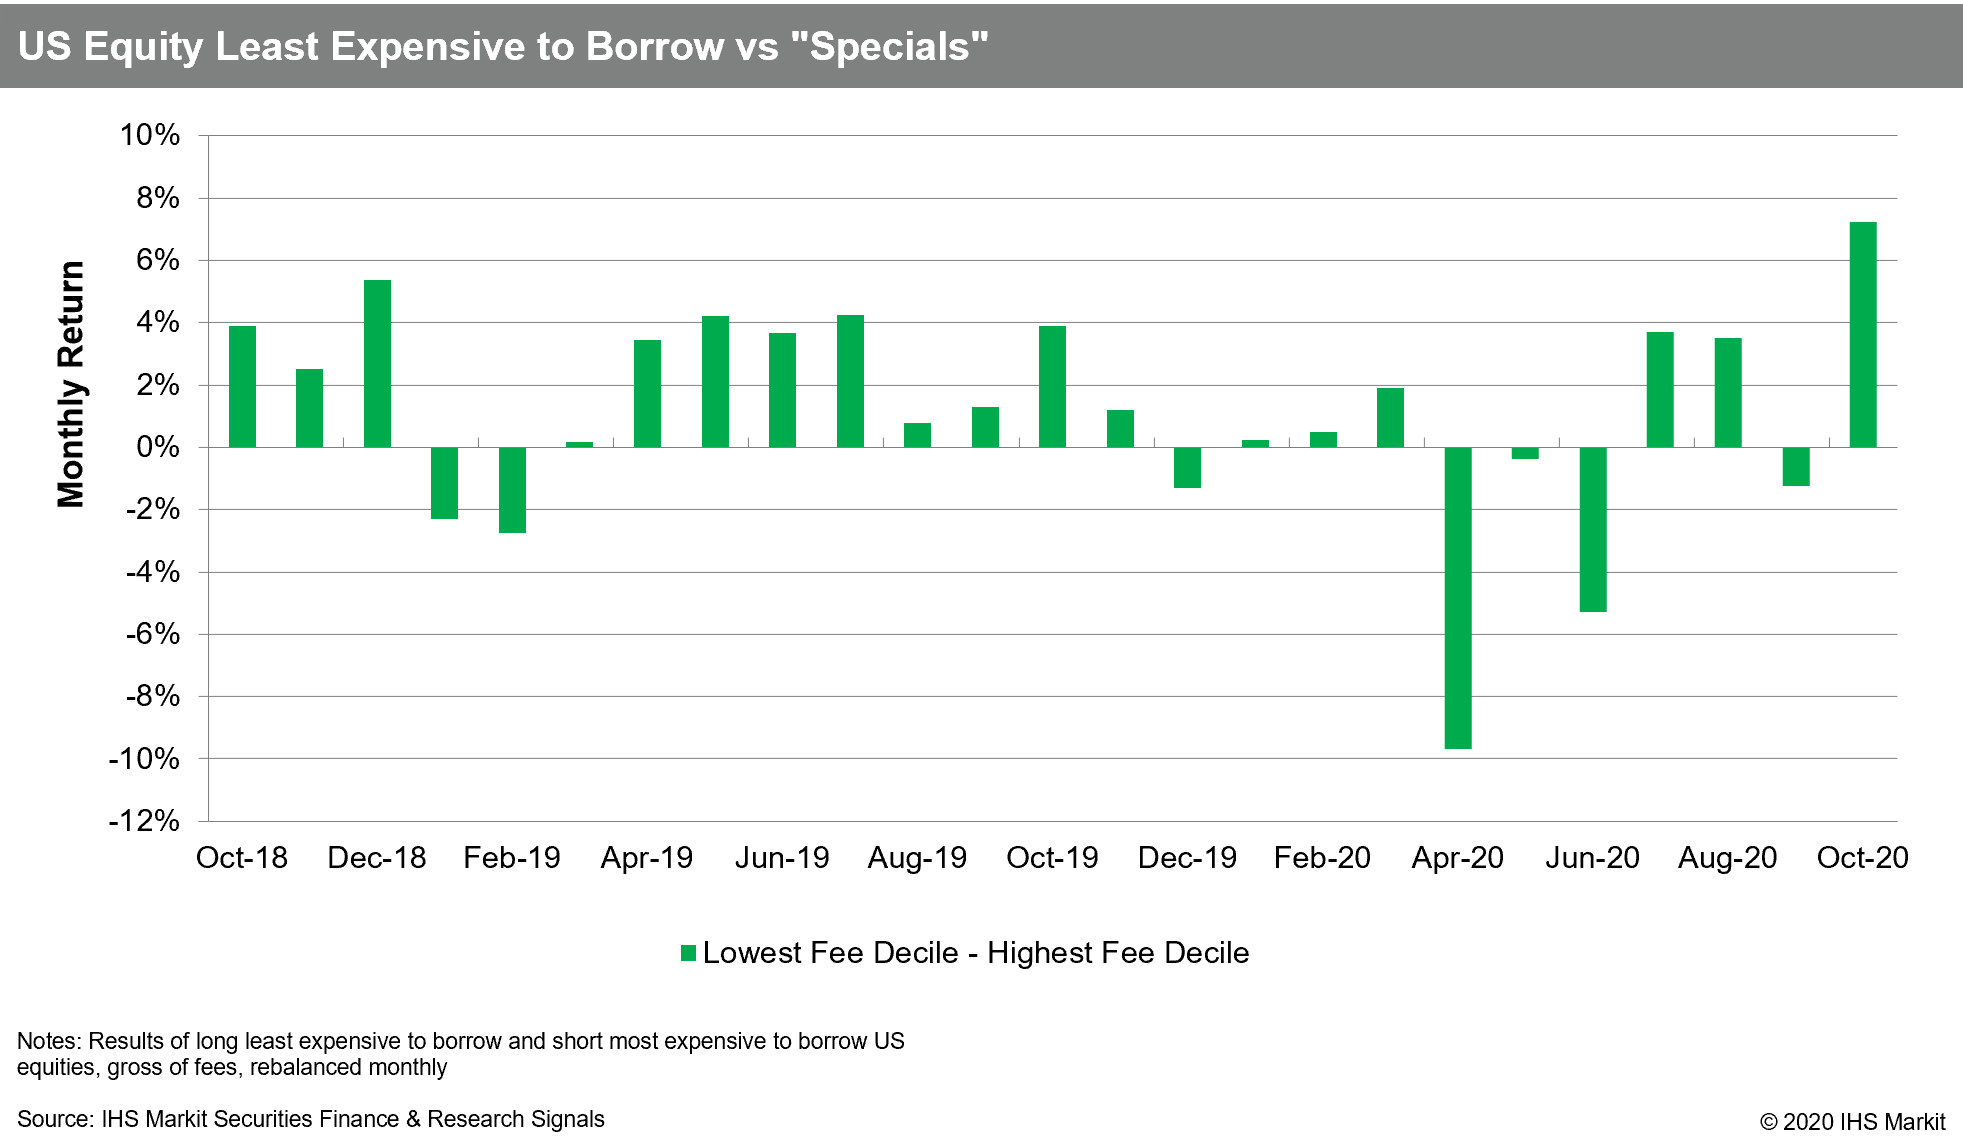
An emerging driver of borrow demand came in the form of returns for short sellers in October, with quant factors derived from securities finance data by IHS Markit Research Signals bouncing back, following a very challenging period which started with the April rally. That result was observed in US, Europe and APAC ex-Japan. Broad positive returns for signals derived from securities finance and short interest data are a boon to equity long-short funds, which in turn may support increased demand for hard-to-borrow shares going forward.
Through the first ten months of 2020 global securities lending returns of $6.9bn reflect a decline of 11% compared with the first ten months of 2019, a result almost entirely driven by lower fee spreads; Global loan balances increased by 2.3% YOY. Revenues have been highly dependent on corporate actions and will likely remain so, however the relative decline in the most-shorted equities may augur well for market liquidity and borrow demand for the remainder of 2020.
Stay tuned for monthly revenue snapshots from IHS Markit Securities Finance!
S&P Global provides industry-leading data, software and technology platforms and managed services to tackle some of the most difficult challenges in financial markets. We help our customers better understand complicated markets, reduce risk, operate more efficiently and comply with financial regulation.
This article was published by S&P Global Market Intelligence and not by S&P Global Ratings, which is a separately managed division of S&P Global.
{"items" : [
{"name":"share","enabled":true,"desc":"<strong>Share</strong>","mobdesc":"Share","options":[ {"name":"facebook","url":"https://www.facebook.com/sharer.php?u=http%3a%2f%2fwww.spglobal.com%2fmarketintelligence%2fen%2fmi%2fresearch-analysis%2fsecurities-finance-october-2020.html","enabled":true},{"name":"twitter","url":"https://twitter.com/intent/tweet?url=http%3a%2f%2fwww.spglobal.com%2fmarketintelligence%2fen%2fmi%2fresearch-analysis%2fsecurities-finance-october-2020.html&text=Securities+Finance%3a+October+2020+Snapshot+%7c+S%26P+Global+","enabled":true},{"name":"linkedin","url":"https://www.linkedin.com/sharing/share-offsite/?url=http%3a%2f%2fwww.spglobal.com%2fmarketintelligence%2fen%2fmi%2fresearch-analysis%2fsecurities-finance-october-2020.html","enabled":true},{"name":"email","url":"?subject=Securities Finance: October 2020 Snapshot | S&P Global &body=http%3a%2f%2fwww.spglobal.com%2fmarketintelligence%2fen%2fmi%2fresearch-analysis%2fsecurities-finance-october-2020.html","enabled":true},{"name":"whatsapp","url":"https://api.whatsapp.com/send?text=Securities+Finance%3a+October+2020+Snapshot+%7c+S%26P+Global+ http%3a%2f%2fwww.spglobal.com%2fmarketintelligence%2fen%2fmi%2fresearch-analysis%2fsecurities-finance-october-2020.html","enabled":true}]}, {"name":"rtt","enabled":true,"mobdesc":"Top"}
]}