Customer Logins
Obtain the data you need to make the most informed decisions by accessing our extensive portfolio of information, analytics, and expertise. Sign in to the product or service center of your choice.
Customer Logins
BLOG
Jan 23, 2019
Securities Finance 2018 Year in Review
- Best post-crisis annual lending revenues: $10.7bn
- EM & Cannabis drive equity lending revenues
- Most lending revenue on record for ETFs: $398m
- Growth in EUR denominated corporate debt demand
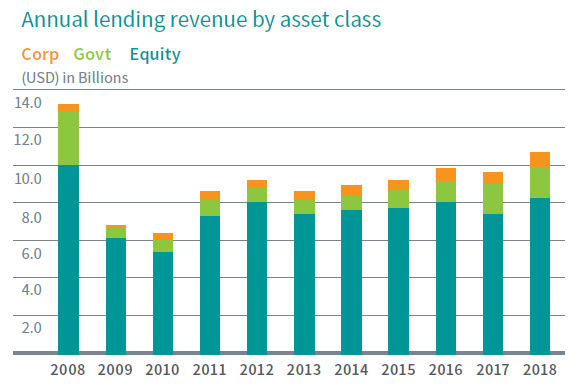
Emerging Market demand, global credit uncertainty and central bank tightening were the primary drivers of revenue for securities lending in 2018. These narratives included trade conflicts, the potential turning of the credit cycle and the coordinated effort to reverse QE and increase rates. The US market diverged from other equity markets in the middle of the year, resulting in pain for US short sellers, as well as a decrease in borrow demand, particularly in specials, during the summer and fall. However, as valuations entered a downtrend in Q2, the demand for Emerging Markets soared with total borrow balances reaching a post-crisis peak in June. It was the best year ever for EM equity lending, delivering over $1bn in revenue for the first time. It was also a banner year for lending ETFs, which delivered $398m in 2018 revenue, an increase of 15% compared with 2017 and the best year on record. Overall, it was the best year since the financial crisis with total securities lending revenue coming in at $10.7bn in 2018.

Equities:
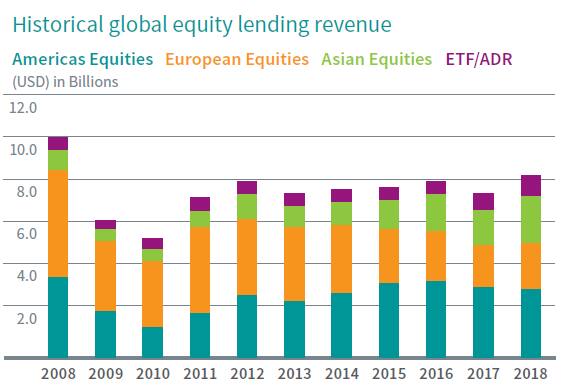
Asia was the bright spot for equity lending, with demand for EM equities surging along with increasing demand for shares of Japanese firms. Revenues in North America were held back by a lack of specials demand, however there was one bright spot discussed below. Overall equity lending revenues were $8.2bn in 2018, which includes all ETFs and ADRs.
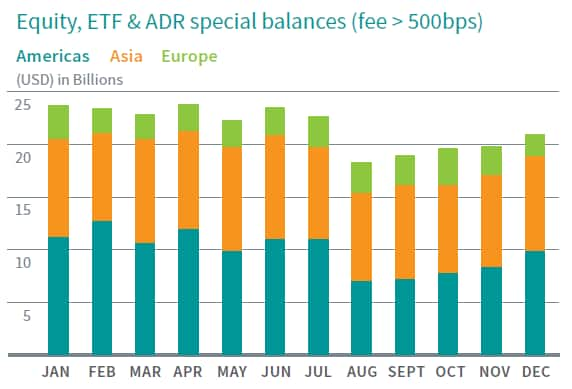
The uptrend in revenues for Japanese equities extended through 2018, with each quarter reflecting an improvement over its 2017 comparable, for a total of $878m. The rate of increase is slowing however, as the 23% YoY improvement in revenues was lower than the prior two years. Specials demand was consistently in the $3-4bn range through the first three quarters before tapering off to $2.7bn in December.

Demand for Hong Kong equities was robust, and the $388m in 2018 revenues are equivalent to an increase of 24% percent compared with 2017, as demand for shares of Chinese firms soared, reaching a post-crisis peak of $34bn in early June.
Revenues for South Korea reached a post-crisis peak with Celltrion delivering 23% percent of the country's $483m in revenue. Shares of Celltrion rallied in 2017, which led to declining borrow demand and fees. 2018 represented a return to form, coming off the back of 2014-2016 when the firm delivered more than 30% of all revenues for South Korean equities.
Revenues for the Americas were subdued by a lack of specials demand and challenging returns for short sellers. Total revenues declined 3% YoY to $3.1bn. Cannabis was the hot sector for region in 2018, delivering $230m in lending revenue, up from $106m in 2017. That is equivalent to 7.4% of all NA equity lending revenue. The top stocks were Tilray, Canopy Growth, Aurora Cannabis and Aphria, which combined for $177m of the total revenue. The sector is likely to deliver again in 2019, as Canada moves closer to full legalization of Cannabis derivatives along with more retail coming on line, the lure of which will likely continue to attract investors on the long and short side. Tilray was the standout from a revenue perspective, delivering $59m in revenue in less than half the year as the result of eye-popping fees.
At the mid-point of 2018, Tesla appeared as a golden egg laying goose, with the equity lending fee in the 2-300bps range on a balance greater than $10bn, while the 5.3% 2025 bond was among the most revenue generating corporate issues. The firm's Q2 and Q3 earnings reports failed to produce a lasting decline in valuations, which resulted in lower fees and borrow demand across the capital structure in the latter half of 2018. Given the volatility of the equity shares, whose price chart bore some resemblance to a cardiograph, long holders who stuck around for the 7% 2018 return could be said to have earned it. The road ahead for the firm, and borrow demand for its securities, is anything but certain: Tesla investors, and drivers, are reminded to keep both hands on the wheel at all times in 2019.

European equities delivered $2.1bn in 2018 revenue, an improvement of 13% compared with 2017, though still 5% below 2016's total. Balances and revenues improved relative to 2017 for the first three quarters before balances fell with the broader market in Q4 as new demand failed to materialize. Popular themes for borrow demand included consumer stocks, particularly retailers. EU special balances averaged between $2.5-$3bn, with the Spanish equities seeing the largest increase in specials balances during 2018.
Corporate Bonds:
Borrow demand for corporate debt also increased throughout 2018, with increased demand for IG USD credits the most notable change in the first half of 2018, with an increase in demand for EUR credits notable in H2. Total revenue for corporate bond lending revenue reached $733m in 2018, the highest level recorded since at least 2006.
Given the scale of outstanding debt, it is unsurprising that USD denominated corporate issues delivered the most revenue for the asset class in 2018, $436m in total, an increase of 8% compared with 2017. However, it is notable that EUR denominated issues posted the largest increase, both in percentage and absolute terms, with total revenues coming in at $186m, a 40% YoY increase. Breaking returns out by credit rating, non-investment grade bonds delivered 63% of all revenue, up from 61% in 2017. The Q4 average corporate on-loan balances were $198bn, the highest on record, as credit spreads widened amid the global sell-off. The broad global increase in demand augurs well for lending opportunities in the asset class for 2019.
Government Bonds:
The demand for government bonds was robust, however the uptrend lost momentum, with a 10% increase in average balances for 2018 compared with 2017 (which had bettered 2016's average by 30%). Average fees also increased, driving $730 in total revenue for 2018, an increase of 13% YoY. There was an upswing in demand for Italian government debt, which delivered $51m in 2018 revenue, the highest level recorded. Emerging Market government bond loan balances were up 11% in 2018 to $17.7bn, however lower fees had a depressing impact on revenues. There was a spike in fees for US Treasuries into the last days of the year, however the impact was much smaller than at year-end 2016.
Wrap-up:
After 2017, a year best defined by low volatility, 2018 was a marked divergence - a benefit then for asset owners that securities lending revenues delivered the best post-crisis return. By way of comparison, total revenues for 2008 were $13.2bn, but not having to go through a financial crisis to achieve 2018's $10.7bn seems a fair tradeoff. The average global revenues over the last ten years have been $8.8bn and the trend higher over the last two years has primarily been driven by increases in Asia and government bond demand.
The road ahead looks bright, with demand trending higher on the margin for US specials at the end of the year, while demand for EM equities remains stable, despite declining valuations and corporate bond demand is trending higher. The rate of increase for Asia and government bond lending revenues is slowing, however both still boasted impressive growth in 2018. On the heels of the best annual lending revenue since 2008, there's cause for optimism looking ahead. Many of the demand drivers for 2018 are at least as relevant coming into the new year, which should make for a fruitful set of opportunities for 2019.
S&P Global provides industry-leading data, software and technology platforms and managed services to tackle some of the most difficult challenges in financial markets. We help our customers better understand complicated markets, reduce risk, operate more efficiently and comply with financial regulation.
This article was published by S&P Global Market Intelligence and not by S&P Global Ratings, which is a separately managed division of S&P Global.
{"items" : [
{"name":"share","enabled":true,"desc":"<strong>Share</strong>","mobdesc":"Share","options":[ {"name":"facebook","url":"https://www.facebook.com/sharer.php?u=http%3a%2f%2fwww.spglobal.com%2fmarketintelligence%2fen%2fmi%2fresearch-analysis%2fsecurities-finance-2018-year-in-review.html","enabled":true},{"name":"twitter","url":"https://twitter.com/intent/tweet?url=http%3a%2f%2fwww.spglobal.com%2fmarketintelligence%2fen%2fmi%2fresearch-analysis%2fsecurities-finance-2018-year-in-review.html&text=Securities+Finance+2018+Year+in+Review+%7c+S%26P+Global+","enabled":true},{"name":"linkedin","url":"https://www.linkedin.com/sharing/share-offsite/?url=http%3a%2f%2fwww.spglobal.com%2fmarketintelligence%2fen%2fmi%2fresearch-analysis%2fsecurities-finance-2018-year-in-review.html","enabled":true},{"name":"email","url":"?subject=Securities Finance 2018 Year in Review | S&P Global &body=http%3a%2f%2fwww.spglobal.com%2fmarketintelligence%2fen%2fmi%2fresearch-analysis%2fsecurities-finance-2018-year-in-review.html","enabled":true},{"name":"whatsapp","url":"https://api.whatsapp.com/send?text=Securities+Finance+2018+Year+in+Review+%7c+S%26P+Global+ http%3a%2f%2fwww.spglobal.com%2fmarketintelligence%2fen%2fmi%2fresearch-analysis%2fsecurities-finance-2018-year-in-review.html","enabled":true}]}, {"name":"rtt","enabled":true,"mobdesc":"Top"}
]}


