


ECONOMICS COMMENTARY — Dec 11, 2024
How to interpret and use the PMI Orders to Inventories ratio

The orders to inventories ratio is a metric derived using monthly manufacturing PMI indices complied by S&P Global Market Intelligence. The ratio is considered a forward-looking indicator for its ability to provide advance signals for future trends in output and prices. Given the timeliness and regularity of the PMI series, the ratio provides valuable, near-real-time insights into business and inventory cycles. It has the further advantage of being comparable across economies and with detailed analysis available by sector.
What does the orders to inventory ratio measure?
While just-in-time production has reduced the impact of the inventory cycle, it is evident that factory and warehouse stock levels have an important part to play in determining business trends in the near-future across many industries.
The PMI orders to inventories ratio is a forward-looking indicator that considers the manufacturing inventory cycle in relation to demand developments, and thus provides insights into likely trends in production. In essence, if factories are seeing higher inflows of orders but have low stock of inventories of finished goods, they are likely to expand production to ensure sales can be fulfilled, and vice versa. This supply-demand imbalance could also affect pricing behaviour.
The series is based on monthly survey responses from manufacturers in relation to new orders and stocks of finished goods data compiled by S&P Global Market Intelligence.
Note that the PMI surveys also track inventories of purchased inputs. This can also be used to derive an orders to inventories ratio to track likely future input buying.
How is the orders to inventories ratio compiled?
The PMI orders to inventories ratio is derived using company data from representative national manufacturing panels. Companies are asked if their new orders and stocks of finished goods are the same, higher, or lower than one month previously:
Please compare the volume of new orders received this month compared to one month ago.
Please compare your stocks of finished goods (volume) this month compared to one month ago.
The ratio is then calculated by dividing the seasonally adjusted Manufacturing New Orders Index by the Manufacturing Stocks of Finished Goods Index.
Why is the orders to inventories ratio important?
Assessing new orders and inventories data together provides a more detailed view on the performance of a manufacturing sector - and thereby an insight into wider economic growth developments.
When the ratio is greater than 1, new orders are rising at a rate faster than manufacturers are building inventories of finished goods. Higher inventory turnover is a positive indicator for future production.
Conversely, when the ratio is less than 1 the reciprocal relationship holds true: inventories are rising faster than sales. This means firms face additional warehousing costs due to overstocking and therefore: firms may cut production to bring inventory holdings back into line with sales growth; or firms could cut their selling prices to encourage sales in order to bring sales into line with inventories. Both actions are damaging to firms' profits and hint at weaker future expansion.
The orders to inventories ratio can therefore be considered a forward-looking indicator given its ability in providing advanced insights into trends for growth, profits and prices.
How can the orders to inventories ratio be used?
Leading indicator of production
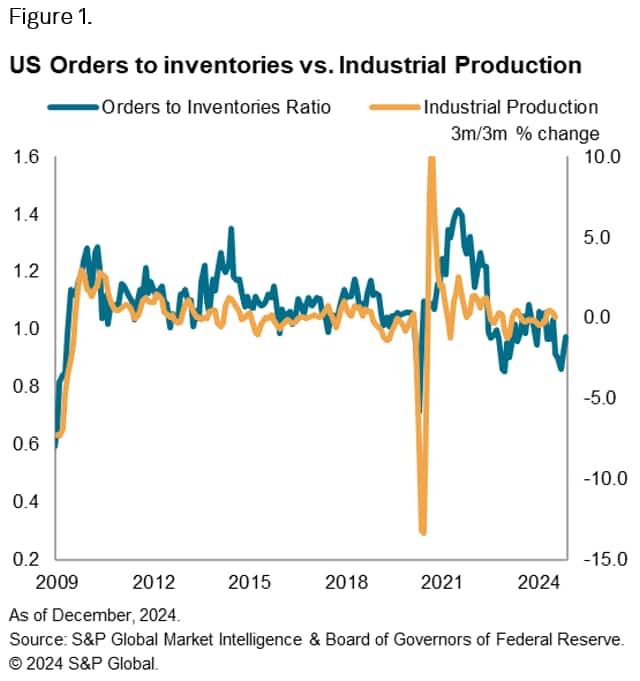
As the orders to inventories ratio reflects the balance (or imbalance) between demand and supply, it can be used to gain insight into the likely direction of firms' production decisions. For example, following a period of increasing orders and reducing inventories (a ratio above 1), manufacturers will typically tend to increase their production volumes in the future to fulfil demand.
Figure 1. highlights the leading properties of the PMI series. The chart not only shows the close association between the US PMI orders to inventories ratio with industrial production, but the official data series is seen to lag slightly behind that of the PMI series, thereby demonstrating the PMI's ability to provide advanced output signals.
Tracking the business cycle
A high orders to inventories ratio is useful in understanding broader economic growth given its measurement of both supply chain efficiency and demand developments. Figure 2. helps to showcase this concept by showing the PMI-based orders to inventories ratio for the Japanese manufacturing sector against changes in Gross Domestic Product (GDP), which is a commonly used metric to represent economic growth.
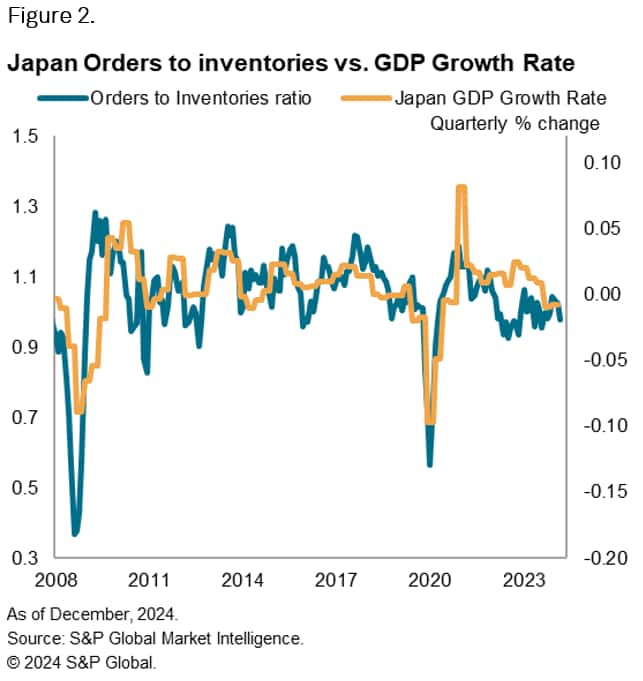
The chart highlights the leading properties of the ratio over GDP and therefore its ability to provide timely business cycle insights. This can be an important information in helping investors, policymakers and other stakeholder detect economic turning points.
Price signals
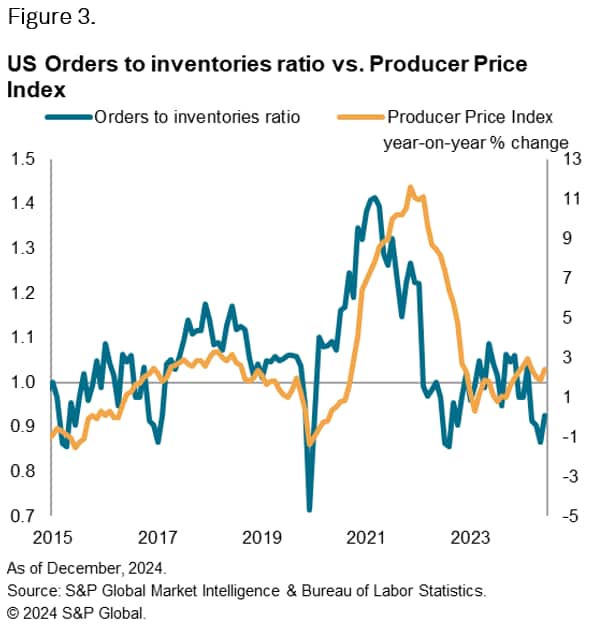
As illustrated in figure 3, there is also an association between the orders to inventories ratio and official producer price data. When the ratio is above the neutral mark of 1, demand is rising at a stronger rate relative to manufacturers' inventory levels. In a simple supply and demand framework, a high orders to inventories ratio implies upward pressure on prices (firms have insufficient stock to meet sales). The inverse relationship follows the principle that when supply (in this case the stock of finished items) is greater than demand (incoming new orders), manufacturers will often offer discounts to stimulate sales and reduce their quantities of warehoused goods.
Figure 3 illustrates the lead the US orders to inventories ratio has over the Producer Price Index, highlighting how the price setting behaviour of manufacturers responds to changes in the ratio.
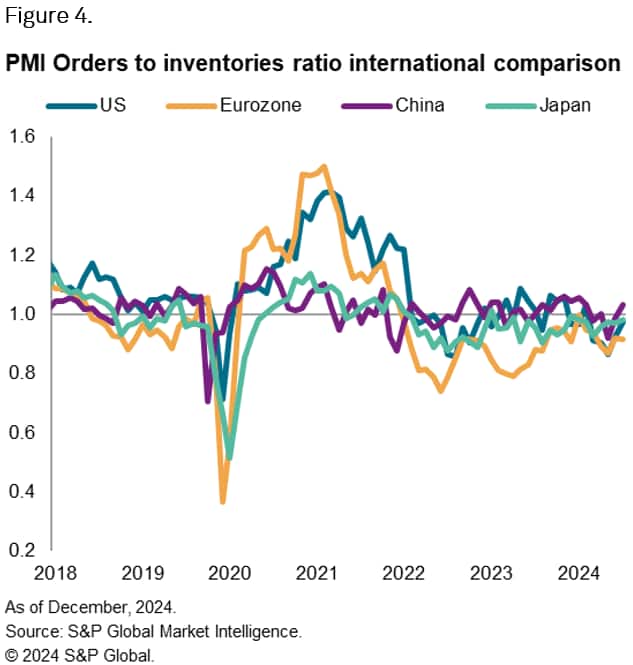
International comparisons
Due to the consistent methodology and extensive global coverage, the PMI series are easily comparable across nations. The coverage of the PMI series extends to over 45 economies, which is equivalent to 90% of global GDP. This therefore allows users to make direct international comparisons, helping to identify changes in economies well ahead of official data. This information is of use to a wide variety of stakeholders, from manufacturers to investors to policymakers.
Sector comparisons
The coverage of the PMI series also extents to more granular global manufacturing sector level data, for which the orders to inventories ratio can be calculated. Coverage includes key manufacturing sectors that fall under the Technology, Basic Materials and Consumer Goods branches.
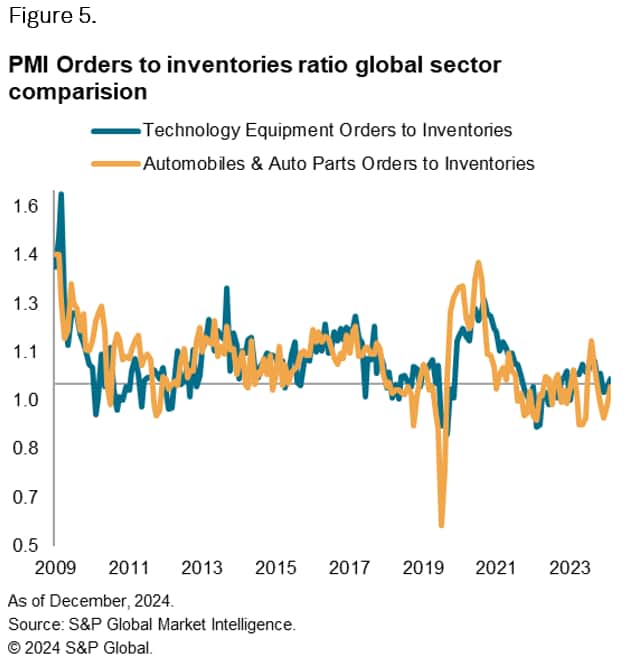
Figure 5 compares the orders to inventories ratio of the global Technology Equipment and Automobiles & Auto Parts sectors.
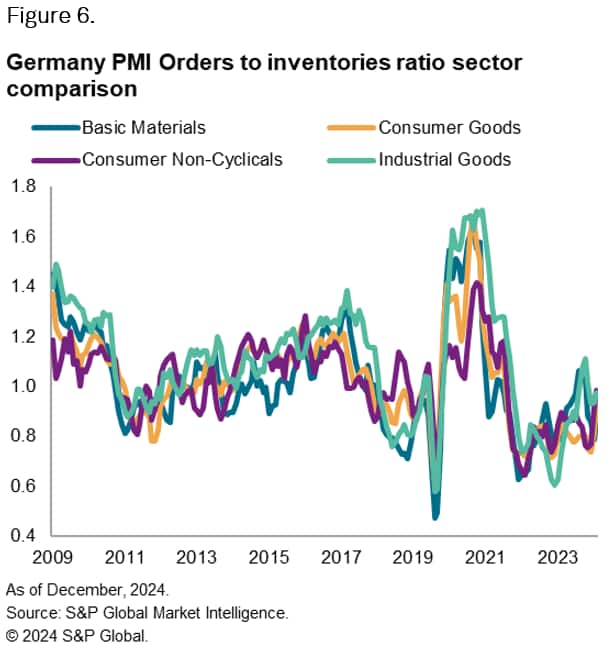
At the broader sector level, data are available for 10 economies, as well as eurozone and APAC aggregates, for which the ratio can be calculated. For example, figure 6 illustrates orders to inventories trends for the broader manufacturing sectors of Germany, useful to a number of stakeholders within this area.
Summary
The orders to inventories ratio is a derived indicator that complements S&P Global's country level datasets, with its value in part stemming from its timely nature and monthly frequency. As shown above, the PMI-based orders to inventories ratio can be applied to a wide variety of use cases. The ratio is a forward-looking indicator given its ability to provide advanced output and price signals. Taking both orders and stocks data into consideration, it can also provide insights into business and inventory cycles.
What are the advantages of the PMI series?
The PMI series provide an advance signal of what is happening in the private sector economy and are advantageous for the following reasons:
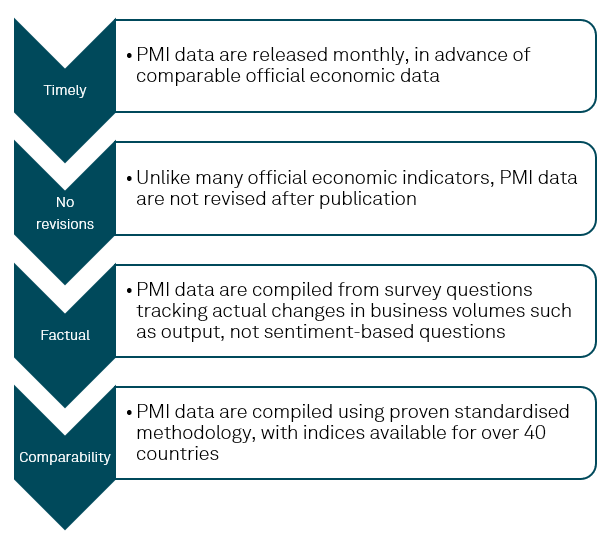
Data are collected mid-month and released at the start of the following reference period and are not revised after publication. The panel is constructed to represent the economy and the survey questions are designed to track actual changes in variables (not sentiment-based).
Eleanor Dennison, Economist, S&P Global Market Intelligence
Tel: +44 1344 328 197
Email: eleanor.dennison@spglobal.com
© 2024, S&P Global. All rights reserved. Reproduction in whole or in part without permission is prohibited.
Purchasing Managers' Index™ (PMI®) data are compiled by S&P Global for more than 40 economies worldwide. The monthly data are derived from surveys of senior executives at private sector companies, and are available only via subscription. The PMI dataset features a headline number, which indicates the overall health of an economy, and sub-indices, which provide insights into other key economic drivers such as GDP, inflation, exports, capacity utilization, employment and inventories. The PMI data are used by financial and corporate professionals to better understand where economies and markets are headed, and to uncover opportunities.
This article was published by S&P Global Market Intelligence and not by S&P Global Ratings, which is a separately managed division of S&P Global.
Location
Products & Offerings