Customer Logins
Obtain the data you need to make the most informed decisions by accessing our extensive portfolio of information, analytics, and expertise. Sign in to the product or service center of your choice.
Customer Logins
ECONOMICS COMMENTARY
Mar 01, 2018
Seeking signs of life as manufacturers report weaker output growth

- PMI drops to eight-month low in February as output growth weakens further
- Order books, inventories and employment data all suggest growth could revive again
- But price pressures remain stubbornly high
PMI survey data showed the UK manufacturing sector growing at the slowest pace for nearly a year in February, putting the sector on course for its weakest calendar quarter since mid-2016. However, other survey indicators suggest growth could pick up again in March, and the slowdown could be in part attributed to supply chain constraints, the development of which also ensured price pressures remained elevated.
Sharply slower output growth
The IHS Markit/CIPS Manufacturing PMI fell for a third successive month in February, nudging down from 55.3 in January to 55.2, its lowest since last June.
PMI Output Index v ONS 3m/3m % change
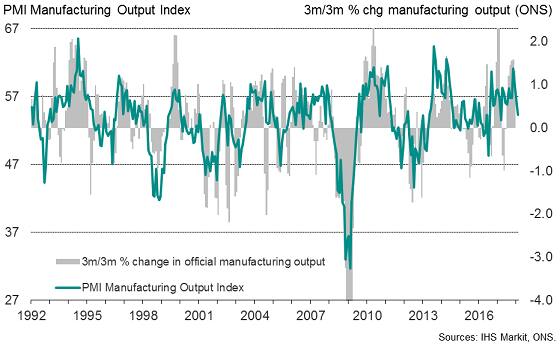
It should be noted that the PMI is a composite indicator based on five survey questions, and the detailed data sent conflicting signals on the health of the industry.
From the perspective of measuring how manufacturing is contributing to current economic growth, the key indicator is the PMI’s Output Index. This gauge fell to 54.3 February, down from 55.8 in January, and is now at its second-lowest since the EU referendum.
The Output Index exhibits a high (78%) correlation with the underlying trend in the official data on manufacturing output growth*. The current reading suggests output is growing at a subdued quarterly rate of 0.4% so far in the opening quarter of 2018 (with a quarterly run-rate of 0.3% signaled for February alone). When compared with the 1.3% expansion recorded in the final quarter of last year, the survey suggests there has been a marked slowdown in production growth.
Encouraging indicators
More encouragingly, there were several indicators from the survey which hint that output growth could re-accelerate in March.
First, February saw the largest monthly influx of new orders since November, suggesting production will need to increase to satisfy rising demand. In fact, the extent to which new orders growth outpaced production growth was the largest since January 2014, and was the joint-largest in more than a decade.
Manufacturing order books
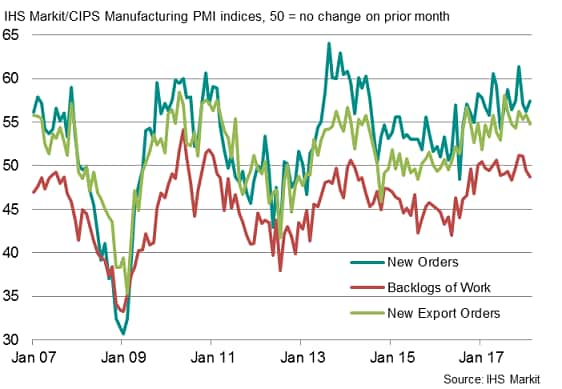
Second, inventories of finished goods fell slightly, meaning the orders-to-inventory ratio increased. This ratio is a key indicator of future production, meaning the recent improvement bodes well for output growth to revive.
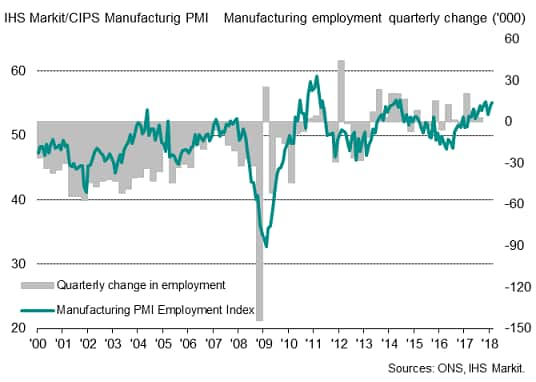
Third, firms took on more staff to meet higher production requirements. The monthly rise in employment was the largest since November and the second-largest for nearly four years. While employment is usually a lagging indicator of output trends, the fact that companies remain sufficiently confident to continue to raise staffing levels augurs well for future production. Business expectations about the outlook also continued to run at one of the highest levels seen over the past three years.
UK factory employment
Fourth, the contrast of the slowdown in production growth relative to the upturn in new orders growth could be in part linked to capacity constraints, and in particular supply chain delays. Reports of longer supplier delivery times were again widely reported in February, and recent months have seen the longest and most significant period of supply chain deterioration since 2011. In many cases, delays have simply been linked to suppliers being unable to meet unexpectedly strong demand. Any easing of such constraints should therefore help drive production higher.
Higher prices
A lingering concern persists in relation to prices. The February survey showed factory input price inflation easing from January’s spike but remaining the second-highest for nearly a year. Suppliers were often reported to have been able to push through higher prices as manufacturers increasingly struggled to ensure delivery of inputs. These higher costs again fed through to higher factory gate prices, with average prices charged rising sharply again in February.
UK factory input prices
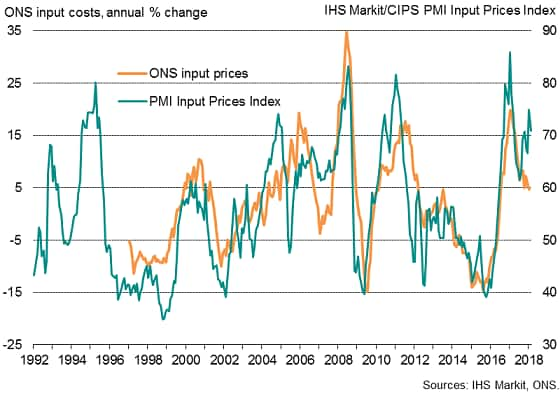
If the PMI price gauges feed through to higher consumer prices, stubbornly high goods inflation means consumption spending could come under further pressure in coming months.
* A note on monthly production growth
We usually compare the PMI Output Index, which measures month-on-month changes in production volumes, with the three-month change in the official data, as monthly changes in the latter are extremely volatile (see our second chart). However, if a moving average of the monthly ONS data is used, it becomes clear that the PMI also acts as a reliable guide to the trend in monthly per cent changes. These comparisons suggest the current PMI Output Index reading is indicative of near-stagnant production in month-on-month terms.
PMI Output Index v ONS monthly % change

Chris Williamson, Chief Business Economist, IHS Markit
Tel: +44 207 260 2329
chris.williamson@ihsmarkit.com
{"items" : [
{"name":"share","enabled":true,"desc":"<strong>Share</strong>","mobdesc":"Share","options":[ {"name":"facebook","url":"https://www.facebook.com/sharer.php?u=http%3a%2f%2fwww.spglobal.com%2fmarketintelligence%2fen%2fmi%2fresearch-analysis%2fseeking-signs-weaker-growth.html","enabled":true},{"name":"twitter","url":"https://twitter.com/intent/tweet?url=http%3a%2f%2fwww.spglobal.com%2fmarketintelligence%2fen%2fmi%2fresearch-analysis%2fseeking-signs-weaker-growth.html&text=Seeking+signs+of+life+as+manufacturers+report+weaker+output+growth","enabled":true},{"name":"linkedin","url":"https://www.linkedin.com/sharing/share-offsite/?url=http%3a%2f%2fwww.spglobal.com%2fmarketintelligence%2fen%2fmi%2fresearch-analysis%2fseeking-signs-weaker-growth.html","enabled":true},{"name":"email","url":"?subject=Seeking signs of life as manufacturers report weaker output growth&body=http%3a%2f%2fwww.spglobal.com%2fmarketintelligence%2fen%2fmi%2fresearch-analysis%2fseeking-signs-weaker-growth.html","enabled":true},{"name":"whatsapp","url":"https://api.whatsapp.com/send?text=Seeking+signs+of+life+as+manufacturers+report+weaker+output+growth http%3a%2f%2fwww.spglobal.com%2fmarketintelligence%2fen%2fmi%2fresearch-analysis%2fseeking-signs-weaker-growth.html","enabled":true}]}, {"name":"rtt","enabled":true,"mobdesc":"Top"}
]}