Customer Logins
Obtain the data you need to make the most informed decisions by accessing our extensive portfolio of information, analytics, and expertise. Sign in to the product or service center of your choice.
Customer Logins
BLOG
Aug 12, 2019
Ranking metropolitan business costs

While business costs can vary significantly across the country and are a prominent consideration for location decisions, firms must weigh many factors when they look to expand or relocate. When there are very different strengths/weaknesses between localities, cost is not the most important factor. While lower costs can serve as a competitive advantage, the other factors at play when judging firm location decisions can be seen when looking at job growth by our Business Cost Index (BCI).
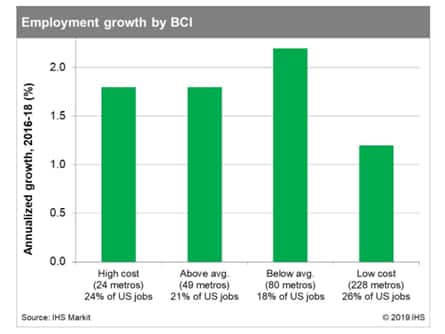
In our analysis of employment trends among both high- and low-costs metros, we find that some of the highest cost areas are among the fastest growing in terms of employment, and lowest cost metros are among the worst performing. The high-cost areas (with costs more than 10% above the US average) have seen employment gains average 1.8% over the past three years. This is in stark contrast to the 1.2% pace that low-cost areas (costs 5% to 20% below the US) experienced. Low costs, it is important to note, can be a product of acute competitive disadvantages, including a dearth of dynamic industries, a small and/or poorly skilled workforce, and low population density, among other factors. Indeed, 228 metros have costs more than 5% lower than the US average, but also sluggish job growth on average.
The most-expensive metros are clustered around the most populous East and West Coast cities. San Francisco; San Jose; New York; San Diego; Los Angeles; Washington, DC; and Boston all rank in the top 15 largest US metro areas. These metros tend to have higher wages than average, and a firm's wage bill is the largest portion of its business costs. Moreover, because of land constraints and high population density, real estate and energy prices are also quite expensive in these areas. In total, 15 metros have costs that exceed 15% of the US average, and combined those metros also account for one-fifth of the total US population.
The seeming sweet spot in terms of job growth has been among metros with costs near or slightly below the US average. Below-average cost metros (up to 5% lower than the nation) have seen job growth average 2.2% over the past three years. This group includes Atlanta, Dallas, Jacksonville, Nashville, Phoenix, and Raleigh. All have populations of at least 1.4 million with Atlanta, Dallas, and Phoenix near 5.0 million or higher. It's a unique position in that these metros feature large population and business clusters at costs near or below the US average. These metros have been hotspots for domestic migration and have seen their populations swell—typically, congestion, land scarcity, and higher-wage jobs tend to escalate in such scenarios, placing upward pressure on costs. However, the metros of the Sunbelt have the advantage of extra real estate—they tend to have much larger areas available for development compared with the denser coastal metro areas of the Northeast and West. As these metros continue to grow, costs will inevitably climb but it takes time for land-rich metros to get built out.
The least-expensive areas tend to be the smaller metros in the Midwest and South. Of the 28 metros where costs are at least 15% below the US average, 23 are in the South and 5 are in the Midwest. These metros combine for just 2% of the nation's population. Here, lower-than-average wages and ample supply of land significantly decrease business costs for firms.
While there are clear regional trends when it comes to costs, there can still be a large degree of variability within a region or even within a state. Laredo, McAllen, and Brownsville, Texas, for example, all have costs among the lowest in the country, while Houston and Austin both have costs above the US average.
Methodology
The BCI summarizes businesses' major costs which vary across the country: labor (including wages, unemployment insurance, and health insurance), energy, real estate, and business taxes and ranks all 381 metropolitan statistical areas (MSAs) in the U.S.
A score above 100 indicates the metro is more expensive for business than the country overall, while a score below 100 means the metro is less expensive. For example, a score of 125 means the metro's cost of doing business is 25 percent higher than the national average.
{"items" : [
{"name":"share","enabled":true,"desc":"<strong>Share</strong>","mobdesc":"Share","options":[ {"name":"facebook","url":"https://www.facebook.com/sharer.php?u=http%3a%2f%2fwww.spglobal.com%2fmarketintelligence%2fen%2fmi%2fresearch-analysis%2franking-metropolitan-business-costs.html","enabled":true},{"name":"twitter","url":"https://twitter.com/intent/tweet?url=http%3a%2f%2fwww.spglobal.com%2fmarketintelligence%2fen%2fmi%2fresearch-analysis%2franking-metropolitan-business-costs.html&text=Ranking+metropolitan+business+costs+%7c+S%26P+Global+","enabled":true},{"name":"linkedin","url":"https://www.linkedin.com/sharing/share-offsite/?url=http%3a%2f%2fwww.spglobal.com%2fmarketintelligence%2fen%2fmi%2fresearch-analysis%2franking-metropolitan-business-costs.html","enabled":true},{"name":"email","url":"?subject=Ranking metropolitan business costs | S&P Global &body=http%3a%2f%2fwww.spglobal.com%2fmarketintelligence%2fen%2fmi%2fresearch-analysis%2franking-metropolitan-business-costs.html","enabled":true},{"name":"whatsapp","url":"https://api.whatsapp.com/send?text=Ranking+metropolitan+business+costs+%7c+S%26P+Global+ http%3a%2f%2fwww.spglobal.com%2fmarketintelligence%2fen%2fmi%2fresearch-analysis%2franking-metropolitan-business-costs.html","enabled":true}]}, {"name":"rtt","enabled":true,"mobdesc":"Top"}
]}