Customer Logins
Obtain the data you need to make the most informed decisions by accessing our extensive portfolio of information, analytics, and expertise. Sign in to the product or service center of your choice.
Customer Logins
COMMENTARY
Mar 10, 2020
March: In like a lion

Research Signals
Market volatility from the end of February spilled over into March, with the coronavirus and implied negative economic impact looming over the stock market. Volatility measures remain high, and as the market entered bear market territory, key benchmarks saw drastic day-to-day, and intraday, spikes and drawdowns. We carry on from last week's special report, looking at daily factor and style model performance for the first week of March in the US, as well as month-to-date results from non-US regions.
- Risk off measures like low beta and bankruptcy risk were the main drivers in US markets last week
- Earnings momentum and price momentum were also rewarded last week, while our Historical Growth Model continued to outpace other style models
- In Developed Europe and Developed Pacific markets, low beta outperformed while value suffered, while emerging markets favored earnings revisions
February and March style model and factor returns
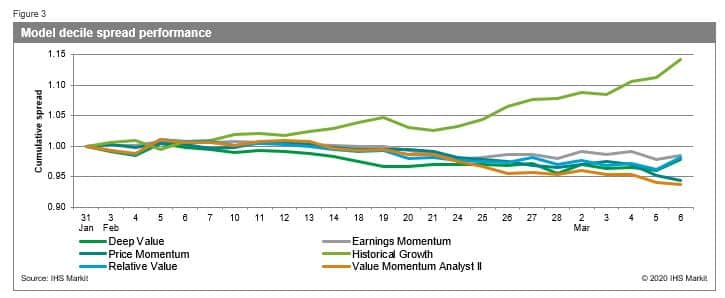
We review daily factor and style model performance in through March 6 across a representative group of our 400+ US factor library in addition to our style models - Deep Value, Earnings Momentum, Price Momentum, Historical Growth, Relative Value and Value Momentum Analyst II. Performance is based on daily decile return spreads, where the spread is computed as the difference in the equal-weighted return at the top (decile 1) and bottom (decile 10) tails. The universe is our US Large Cap universe, which consists of approximately 1,000 of the largest cap names.
First, from a factor perspective, we focus our results on several factors of interest (Figure 1) covering value, momentum, size, risk and short sentiment signals, namely Book-to-Market, TTM EBITDA-to-Enterprise Value, 3-M Revision in FY2 EPS Forecasts, Industry-adjusted 12-Month Relative Price Strength, Natural Logarithm of Market Capitalization, 60-Month Beta, Altman Z-score and Demand Supply Ratio.
In our prior report, we highlighted the "risk-off" trade in the
last week of February. The first week of March saw a further shift
away from high risk names (Figure 1). 60-month Beta, favoring low
risk stocks was positive for all 5 days last week, returning over
20% cumulative since the end of January, with most of that return
earned since 21 February. Momentum also gained consistent traction
last week, with Industry-adjusted 12-Month Relative Price Strength
and 3-M Revision in FY2 EPS Forecasts continuing to outpace other
factors. The losers in February - Book-to-market, Altman Z-score,
and Natural Logarithm of Market Capitalization - all lost at least
5% in the first week of March.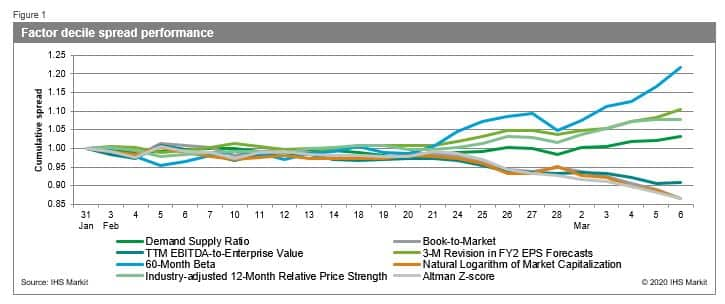
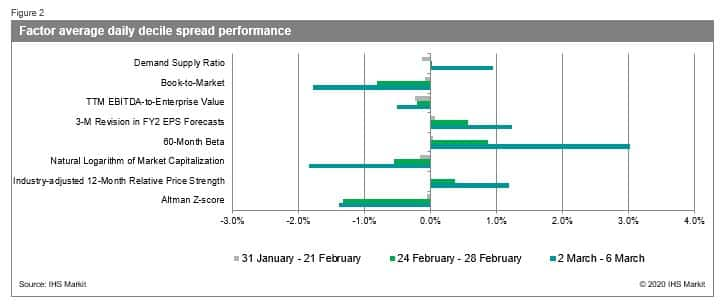
For another perspective, we compare average daily decile spreads month-to-date through 21 February with those in the last week of the month and the first week of March (Figure 2) to provide a more focused view of the extreme behavior between the three periods. From this vantage point, we can more clearly uncover that the returns we saw the last week of February have been amplified in the first week of March. Investors continued to trade out of high bankruptcy risk names into low beta stocks, with the low beta factor earning a daily average of 3% last week. The shift from value to continued as well, and Demand Suppy Ratio, a measure that favors stocks with low implied short interest, came to life with a nearly 1% average daily return.
Returns for our style models picked up where they left off through the first week of March, with Historical Growth reaching over 14% cumulative return through 6 March (Figure 3). Interestingly, Deep Value and Relative Value, while continuing to underperform Historical Growth for most of the week, had a slight reversal on Friday of roughly 2%, while Price Momentum and Value Momentum Analyst II raced each other to the bottom.
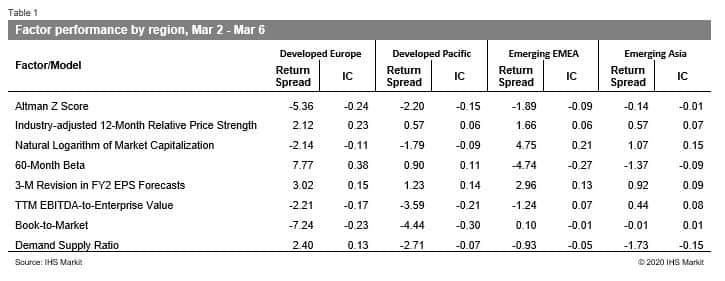
With the market turmoil spreading across the globe we look at Return Spreads and Information Coefficients for the same set of factors in non-US universes, covering Developed Europe, Developed Pacific, Emerging EMEA, and Emerging Asia, for the first week of March. We find results for Developed Europe and Developed Pacific mirror those seen in the US, with the risk off trade elevating the performance for 60-Month Beta, while causing Altman Z Score and value factors like Book-to-Market to suffer. The emerging markets universes tell a different story. In Emerging EMEA, small caps outperformed while value was fairly flat, and the Beta factor underperformed. Factor performance was relatively muted in Emerging Asia, with small caps and 3-M Revision in FY2 EPS Forecasts being the top performers with return spreads near 1% over the past week.
IHS Markit Customer Support:
Support@ihsmarkit.com
Americas: +1 877 762 7548
Europe, Middle East, and Africa: 00800 6275 4800
Asia and the Pacific Rim: +65 6922 4210
S&P Global provides industry-leading data, software and technology platforms and managed services to tackle some of the most difficult challenges in financial markets. We help our customers better understand complicated markets, reduce risk, operate more efficiently and comply with financial regulation.
This article was published by S&P Global Market Intelligence and not by S&P Global Ratings, which is a separately managed division of S&P Global.
{"items" : [
{"name":"share","enabled":true,"desc":"<strong>Share</strong>","mobdesc":"Share","options":[ {"name":"facebook","url":"https://www.facebook.com/sharer.php?u=http%3a%2f%2fwww.spglobal.com%2fmarketintelligence%2fen%2fmi%2fresearch-analysis%2fmarch-in-like-a-lion.html","enabled":true},{"name":"twitter","url":"https://twitter.com/intent/tweet?url=http%3a%2f%2fwww.spglobal.com%2fmarketintelligence%2fen%2fmi%2fresearch-analysis%2fmarch-in-like-a-lion.html&text=March%3a+In+like+a+lion+%7c+S%26P+Global+","enabled":true},{"name":"linkedin","url":"https://www.linkedin.com/sharing/share-offsite/?url=http%3a%2f%2fwww.spglobal.com%2fmarketintelligence%2fen%2fmi%2fresearch-analysis%2fmarch-in-like-a-lion.html","enabled":true},{"name":"email","url":"?subject=March: In like a lion | S&P Global &body=http%3a%2f%2fwww.spglobal.com%2fmarketintelligence%2fen%2fmi%2fresearch-analysis%2fmarch-in-like-a-lion.html","enabled":true},{"name":"whatsapp","url":"https://api.whatsapp.com/send?text=March%3a+In+like+a+lion+%7c+S%26P+Global+ http%3a%2f%2fwww.spglobal.com%2fmarketintelligence%2fen%2fmi%2fresearch-analysis%2fmarch-in-like-a-lion.html","enabled":true}]}, {"name":"rtt","enabled":true,"mobdesc":"Top"}
]}