Customer Logins
Obtain the data you need to make the most informed decisions by accessing our extensive portfolio of information, analytics, and expertise. Sign in to the product or service center of your choice.
Customer Logins
BLOG
Nov 23, 2020
Institutional Ownership Data: Quantitative Research Note
Research Signals - October 2020
Introduction and methodology
In this research note, IHS Markit's internal quantitative research group, Research Signals, reports our initial research using the IHS Markit institutional ownership point-in-time dataset. Using the company holdings data, we construct 17 factors built from holdings and trading activity. Factors introduced evaluate ownership concentration, changes in holdings, institutional and hedge fund holdings and liquidity flow ratios globally across developed and emerging markets.
To test factor efficacy, we calculate simulated long-short decile portfolio returns using the following method. First, percentile ranks for each factor are computed across each universe by sorting according to the underlying factor interpretation. We begin with the percentile ranks at the beginning of each month and divide the universe into ten deciles, with the top ranked, or buy-rated, names assigned to decile 1 (D1) and the bottom ranked, or sell-rated, names in decile 10 (D10). At the end of each month, we then compute the equal-weighted decile return using USD total returns and report the return spread between D1 and D10, simulating a long-short portfolio. Note that we use quintiles rather than deciles for emerging markets due to smaller universe sizes.
Factors are backtested over the Research Signals standard universes. The US Total Cap universe represents 98% of the cumulative market cap, or approximately 3,000 names, while the developed and emerging markets universes represent 95% of cumulative market cap for each member country subject to minimum market caps of USD 250 million and 100 million, respectively. Average monthly decile return spreads are reported for the full backtest period from February 2016 through June 2020. We highlight the monthly time series of cumulative spreads (interpreted as the growth of a dollar) for key factors regionally, with the full results for each factor across each universe summarized in the table at the end of this report, followed by the factor definitions.
Results
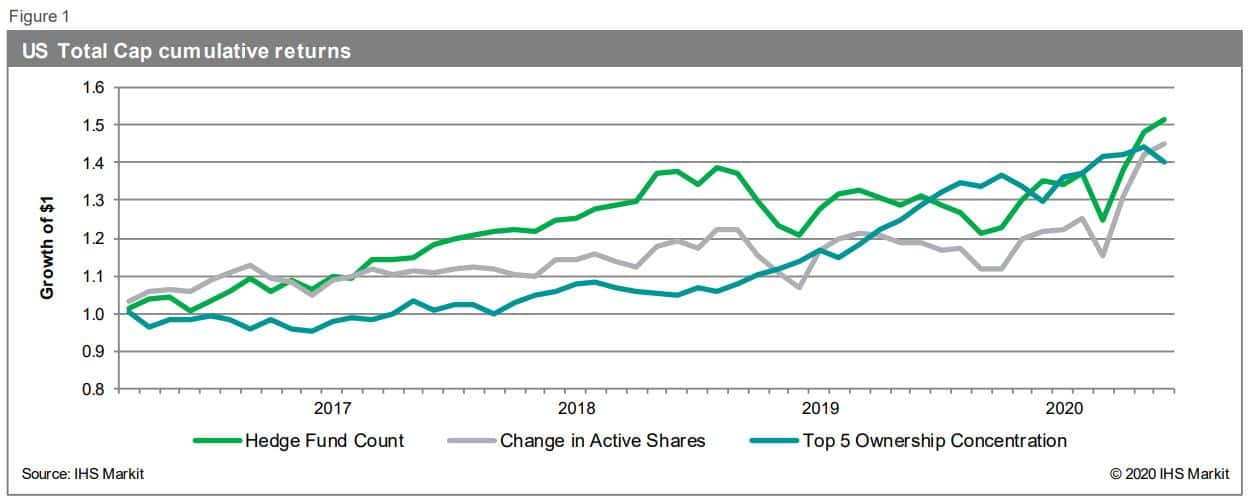
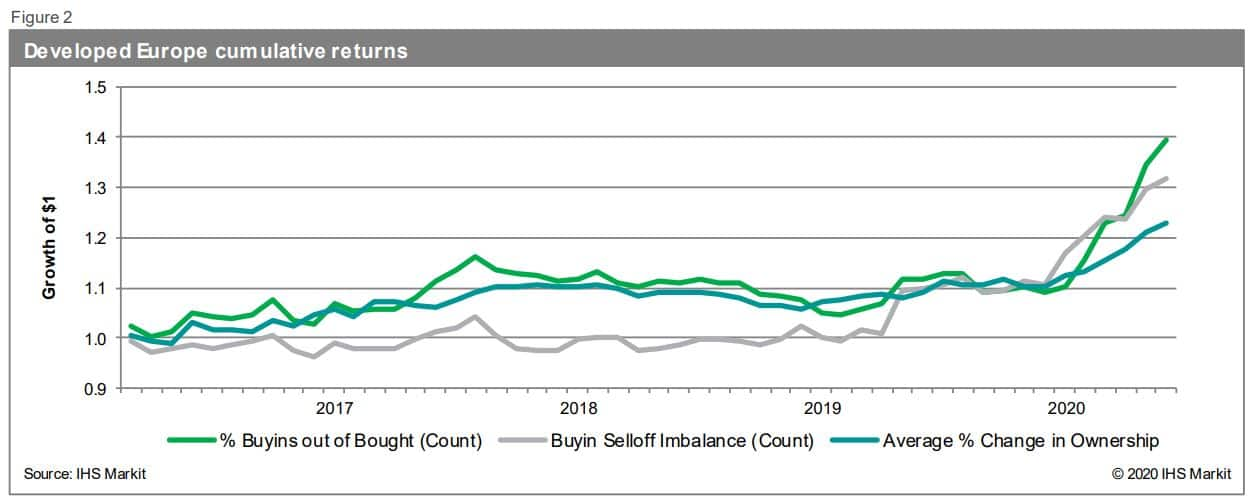
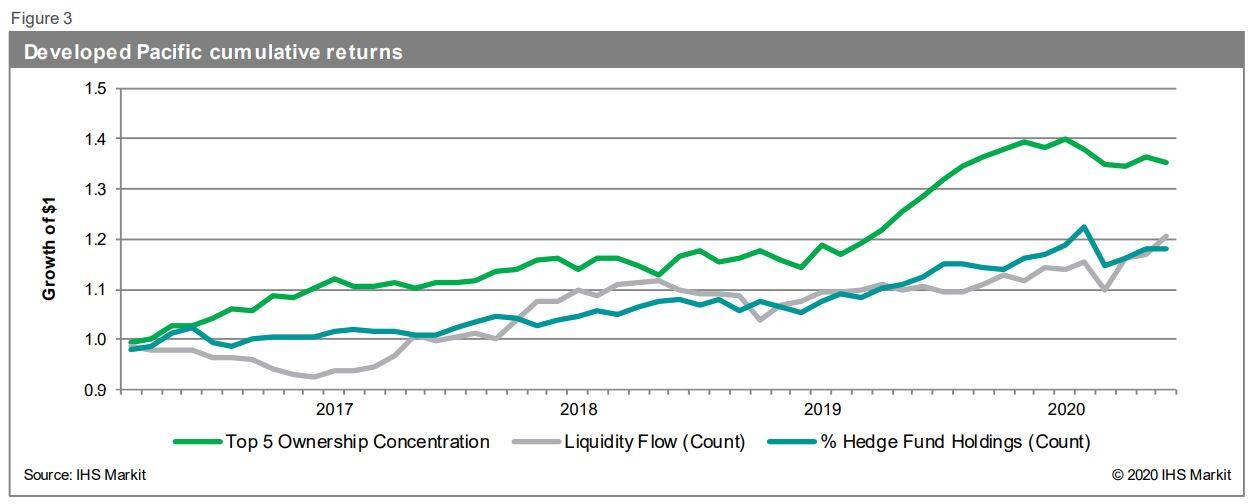
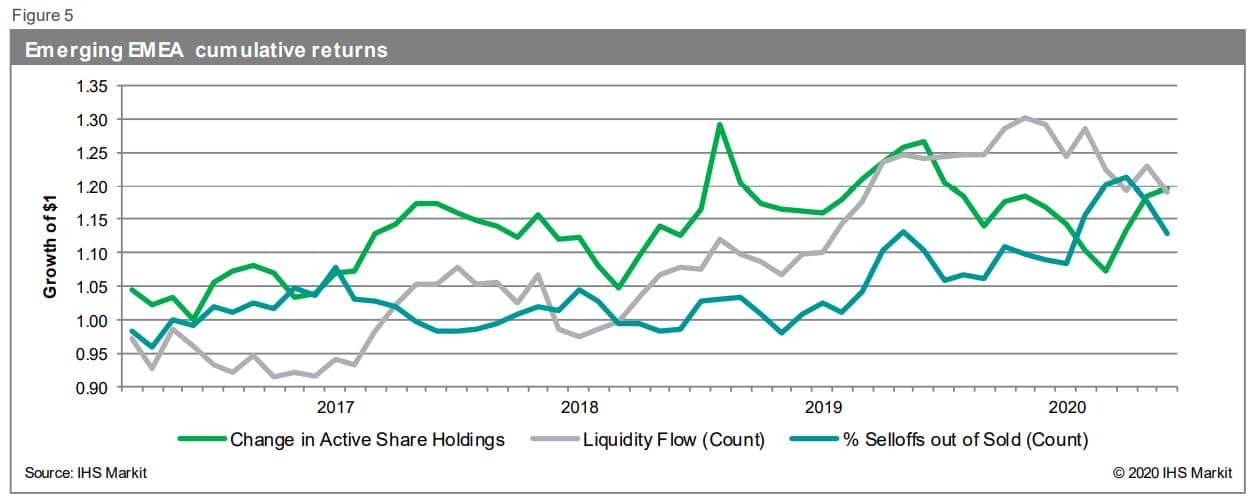
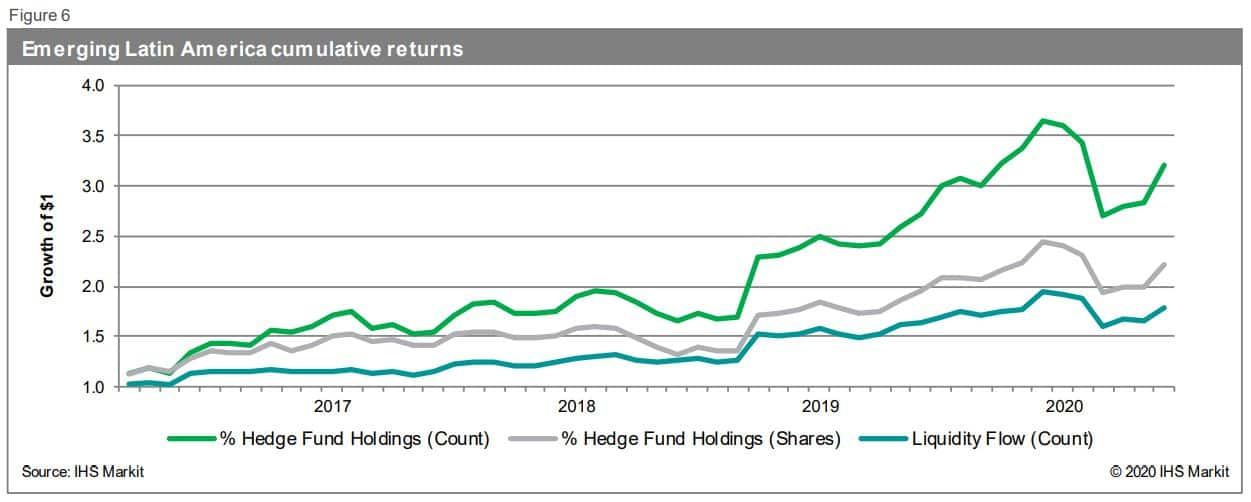
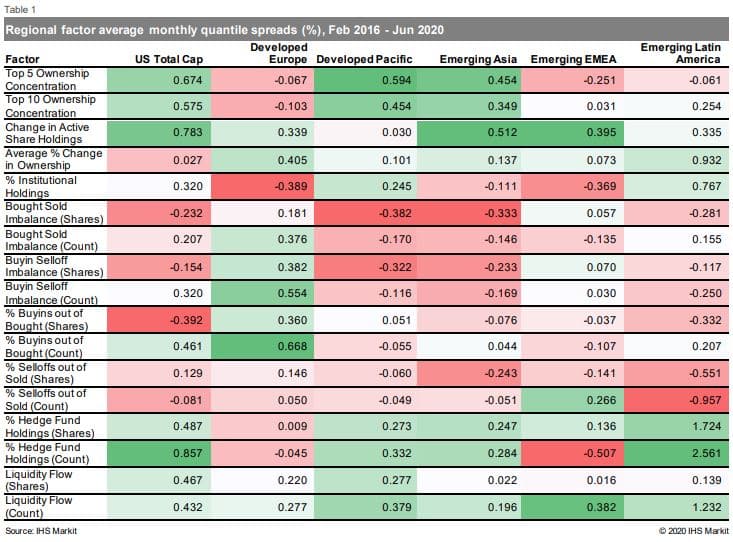
For the US Total Cap universe, the top performing factors include Change in Active Shares, Hedge Fund Count and Top 5 Ownership Concentration, with the latter two also capping performance in Developed Pacific, along with Liquidity Flow (Count). The highest average monthly spreads in Developed Europe were turned in by % Buyins out of Bought (Count), Buyin-Selloff Imbalance (Count) and Average % Change in Ownership.
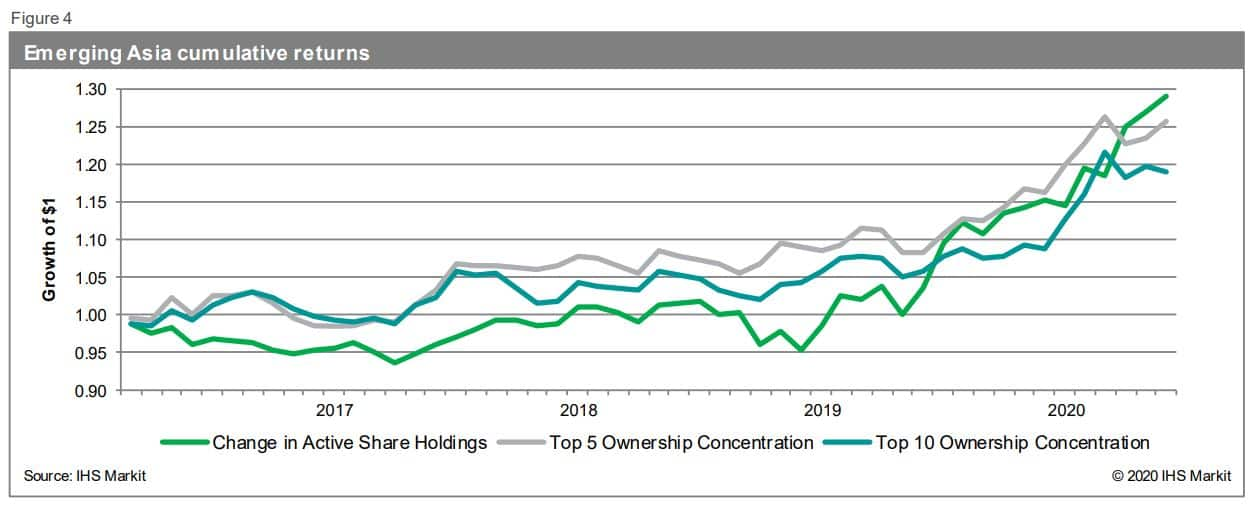
The following six figures show the best performing factors in each market segment tracking the growth of $1 over the backtest time period. Table 1 is a matrix showing all factors performance, followed by a description of all the factors used. Additional results and details are available upon request.
 Factor List
Top 5 Ownership Concentration - Sum of top 5 institutional holdings of a stock as a ratio of total institutional holdings, sorted in ascending order
Top 10 Ownership Concentration - Sum of top 10 institutional holdings of a stock as a ratio of total institutional holdings, sorted in ascending order
Change in Active Share Holdings - 3-month change in active shares as a percent of total institutional holdings, sorted in descending order
Average % Change in Ownership - Average change in institutional holdings of a stock relative to the prior 3-month institutional holdings, sorted in descending order
% Institutional Holdings - Total institutional holdings of a stock as a percent of total shares outstanding, sorted in descending order
Bought Sold Imbalance (Shares) - Total shares bought by institutions less sold relative to the total shares bought and sold by institutions, sorted in descending order
Bought Sold Imbalance (Count) - Number of institutions buying a stock less selling relative to the total number of institutions buying and selling the stock, sorted in descending order
Buyin Selloff Imbalance (Shares) - Total shares of newly opened positions by institutions less shares of closed positions relative to the total number of buyin and selloff shares by institutions, sorted in descending order
Buyin Selloff Imbalance (Count) - Number of institutions with newly opened positions less closed positions relative to the total number of buyins and selloffs, sorted in descending order
% Buyins out of Bought (Shares) - Total shares of newly opened positions by institutions as a percent of total shares bought by institutions, sorted in descending order
% Buyins out of Bought (Count) - Number of institutions with newly opened positions as a percent of number of institutions buying, sorted in descending order
% Selloffs out of Sold (Shares) - Total shares of closed positions by institutions as a percent of total shares sold by institutions, sorted in ascending order
% Selloffs out of Sold (Count) - Number of institutions with closed positions as a percent of number of institutions selling, sorted in ascending order
% Hedge Fund Holdings (Count) - Number of hedge fund investors in a stock as a percent of total number of institutional investors, sorted in descending order
% Hedge Fund Holdings (Shares) - Total shares held in hedge funds as a percent of total institutional holdings, sorted in descending order
Liquidity Flow (Shares) - Total shares held by active institutions as a ratio of total institutional holdings, sorted in descending order
Liquidity Flow (Count) - Number of active institutional investors in a stock as a ratio of total number of institutional investors in the stock, sorted in descending order
Contacts
Research Signals ∙ MK-ResearchSignals@ihsmarkit.com
Sales ∙ Selina.Navarro@ihsmarkit.com
S&P Global provides industry-leading data, software and technology platforms and managed services to tackle some of the most difficult challenges in financial markets. We help our customers better understand complicated markets, reduce risk, operate more efficiently and comply with financial regulation.
This article was published by S&P Global Market Intelligence and not by S&P Global Ratings, which is a separately managed division of S&P Global.
{"items" : [
{"name":"share","enabled":true,"desc":"<strong>Share</strong>","mobdesc":"Share","options":[ {"name":"facebook","url":"https://www.facebook.com/sharer.php?u=http%3a%2f%2fwww.spglobal.com%2fmarketintelligence%2fen%2fmi%2fresearch-analysis%2finstitutional-ownership-data-quantitative-research-note.html","enabled":true},{"name":"twitter","url":"https://twitter.com/intent/tweet?url=http%3a%2f%2fwww.spglobal.com%2fmarketintelligence%2fen%2fmi%2fresearch-analysis%2finstitutional-ownership-data-quantitative-research-note.html&text=Institutional+Ownership+Data%3a+Quantitative+Research+Note+%7c+S%26P+Global+","enabled":true},{"name":"linkedin","url":"https://www.linkedin.com/sharing/share-offsite/?url=http%3a%2f%2fwww.spglobal.com%2fmarketintelligence%2fen%2fmi%2fresearch-analysis%2finstitutional-ownership-data-quantitative-research-note.html","enabled":true},{"name":"email","url":"?subject=Institutional Ownership Data: Quantitative Research Note | S&P Global &body=http%3a%2f%2fwww.spglobal.com%2fmarketintelligence%2fen%2fmi%2fresearch-analysis%2finstitutional-ownership-data-quantitative-research-note.html","enabled":true},{"name":"whatsapp","url":"https://api.whatsapp.com/send?text=Institutional+Ownership+Data%3a+Quantitative+Research+Note+%7c+S%26P+Global+ http%3a%2f%2fwww.spglobal.com%2fmarketintelligence%2fen%2fmi%2fresearch-analysis%2finstitutional-ownership-data-quantitative-research-note.html","enabled":true}]}, {"name":"rtt","enabled":true,"mobdesc":"Top"}
]}