Customer Logins
Obtain the data you need to make the most informed decisions by accessing our extensive portfolio of information, analytics, and expertise. Sign in to the product or service center of your choice.
Customer Logins
CREDIT COMMENTARY
Mar 21, 2016
Investors continue to flock towards munis amid volatility
Investors have continued to favour tax exempt US municipal bonds over treasuries this year, despite the former underperforming amid volatile markets.
- Treasury yields fell 66bps from the start of the year to February 11th, while equivalent muni yields have fallen 33bps
- The 10-yr muni/treasury ratios is currently 0.98, higher than the historical average
- The excess muni fund flows over treasury fund flows has continued to remain positive despite volatile financial markets
Tax exempt US municipal bonds (munis) have underperformed treasuries amid volatile markets so far this year, making the asset class look historically cheap in comparison.
Due to their tax exempt status, munis have historically traded at lower yields to US treasuries, but recent volatility in global financial markets has seen this trend reverse. This saw treasury yields converge with lower yielding comparable AAA rated munis so far this year.
Increased investor appetite for treasuries has also meant that the excess of muni fund flows over treasury fund flows narrowed over the past few months but still favour munis as the asset class continues to see strong inflows.
Yields converge
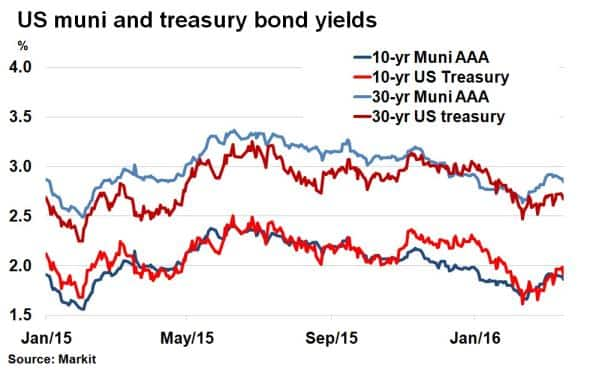
10-yr US treasury yields fell to 66bps to 1.61% on February 11th, from a 2.27% yield at the start of the year. Over the same period, AAA rated munis saw 10-yr yields fall 33bps according to Markit's muni bond pricing service, highlighting the relative underperformance of muni bonds. This meant that the closely followed 10-yr yield ratio between the two asset classes (munis yield/treasury bond yield) rose from 0.87 to 1.02 over the period, as tightening in munis bond yields trailed US treasuries. It was the same case for the 30-yr bonds, where the muni/treasury yield ratio had risen to 1.07 on February 11th 17th, from 0.98 at the start of the year.
A high muni/treasury ratio implies munis are more attractive than treasuries given that the historical muni/treasury ratio has been around 0.80. As of 17th March, muni/treasury ratios show the 10-yr is currently 0.98 and the 30-yr 1.06.
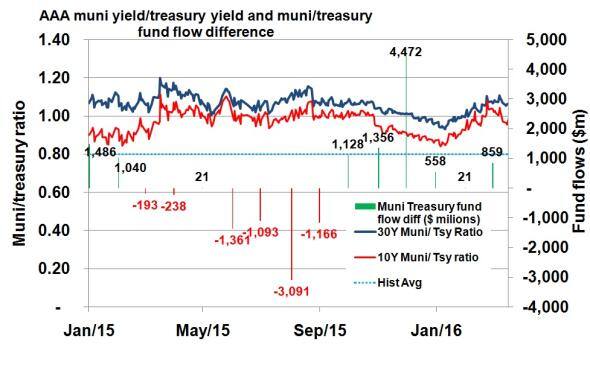
The muni/treasury ratio had been on a downward trajectory during the second half of 2015, as fears of a slowdown in China and emerging markets subsided. But market volatility at the start of the year saw the muni/treasury ratio move higher as treasury yields tightened.
Despite the risk off sentiment, capital continued to flock towards the munis market, while treasury flows remained robust. According to ICI, an organisation that captures mutual fund flow data, the excess muni fund flows over treasury fund flows has exhibited a negative correlation to the muni/treasury ratio over the past year. Periods of higher excess muni fund flows have coincided with lower muni/ treasury ratios, and vice versa. This year, as the muni/treasury ratio has risen, treasury flows have started to become more popular, owing to its safe haven status, but muni flows have continued to surpass them, showcasing investor confidence in the asset class.
Neil Mehta | Analyst, Fixed Income, Markit
Tel: +44 207 260 2298
Neil.Mehta@markit.com
S&P Global provides industry-leading data, software and technology platforms and managed services to tackle some of the most difficult challenges in financial markets. We help our customers better understand complicated markets, reduce risk, operate more efficiently and comply with financial regulation.
This article was published by S&P Global Market Intelligence and not by S&P Global Ratings, which is a separately managed division of S&P Global.
{"items" : [
{"name":"share","enabled":true,"desc":"<strong>Share</strong>","mobdesc":"Share","options":[ {"name":"facebook","url":"https://www.facebook.com/sharer.php?u=http%3a%2f%2fwww.spglobal.com%2fmarketintelligence%2fen%2fmi%2fresearch-analysis%2f21032016-Credit-Investors-continue-to-flock-towards-munis-amid-volatility.html","enabled":true},{"name":"twitter","url":"https://twitter.com/intent/tweet?url=http%3a%2f%2fwww.spglobal.com%2fmarketintelligence%2fen%2fmi%2fresearch-analysis%2f21032016-Credit-Investors-continue-to-flock-towards-munis-amid-volatility.html&text=Investors+continue+to+flock+towards+munis+amid+volatility","enabled":true},{"name":"linkedin","url":"https://www.linkedin.com/sharing/share-offsite/?url=http%3a%2f%2fwww.spglobal.com%2fmarketintelligence%2fen%2fmi%2fresearch-analysis%2f21032016-Credit-Investors-continue-to-flock-towards-munis-amid-volatility.html","enabled":true},{"name":"email","url":"?subject=Investors continue to flock towards munis amid volatility&body=http%3a%2f%2fwww.spglobal.com%2fmarketintelligence%2fen%2fmi%2fresearch-analysis%2f21032016-Credit-Investors-continue-to-flock-towards-munis-amid-volatility.html","enabled":true},{"name":"whatsapp","url":"https://api.whatsapp.com/send?text=Investors+continue+to+flock+towards+munis+amid+volatility http%3a%2f%2fwww.spglobal.com%2fmarketintelligence%2fen%2fmi%2fresearch-analysis%2f21032016-Credit-Investors-continue-to-flock-towards-munis-amid-volatility.html","enabled":true}]}, {"name":"rtt","enabled":true,"mobdesc":"Top"}
]}