Customer Logins
Obtain the data you need to make the most informed decisions by accessing our extensive portfolio of information, analytics, and expertise. Sign in to the product or service center of your choice.
Customer Logins
EQUITIES COMMENTARY
Dec 15, 2014
Measuring a year in short sentiment
Markit's Research Signals services reveal the solid performances posted by short sentiment factors and models this year to date, and highlight a common theme of short sentiment explaining returns.
- Shorting factors delivered cumulative returns of 23.5% and 15.5% in the US and Europe respectively
- In Europe and Asia Pacific, the Earnings Momentum model delivered strong return spreads throughout the year
- Short sentiment and analyst forecasts captured in models explain a significant and meaningful portion of returns in 2014
A review of the best performing models and factors so far this year sees the most shorted shares consistently underperform those that short sellers avoided across the world. We review this trend, along with the performance of other strongly performing factors.
US trends
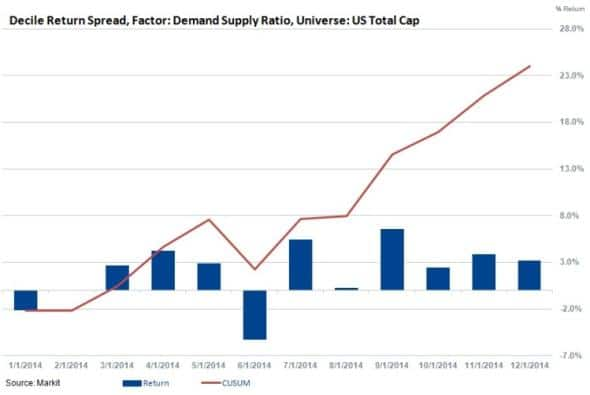
A top short sentiment factor in the universe was the Demand Supply Ratio (DSR), this ratio is defined as the amount of stock borrowed by short sellers as a ratio of the inventory of the stock, and this figure is then ranked in ascending order.
Using this factor, we find that short sellers have broadly performed well over this year as the shares which saw the greatest demand to borrow underperformed those on the other side of the demand scale over the last 12 months.
The factor delivered a cumulative return of 23.5% with an impressive 75% hit rate. This would have been achieved by going long the bottom ranked companies representing those least in demand to be borrowed, and shorting the top decile - those most in demand to be borrowed.
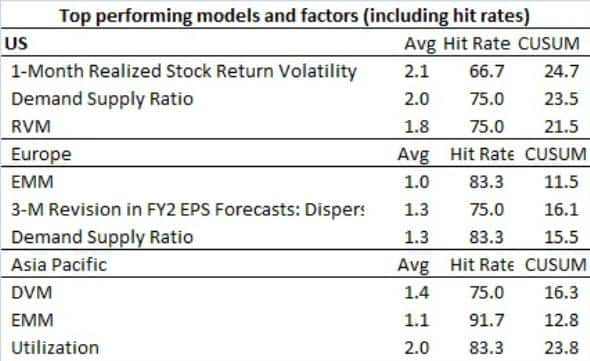
The best performing model in 2014 in the US *Total Cap universe, is the relative value model which delivered a cumulative sum (cusum) return of 21.5% in 2014 with a hit rate of 75% (accuracy). This model uses five factors, including return on equity and earnings yield, to pick out shares which offer good value. Essentially, the fact that this model has performed so strongly throughout this year tells you that US investors have chosen to bid up shares with good fundamental valuations over their peers.
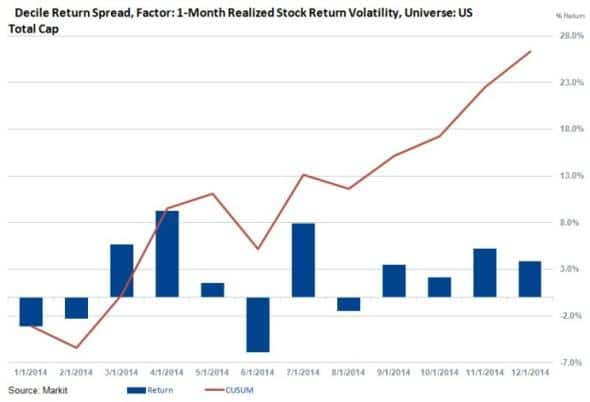
The top performing factor in the US for 2014 thus far, the 1-Month Realized Stock Return Volatility factor, returned 2.1% on average per month (24.7% cusum) indicating that investors were rewarded for holding the least risky stocks, something which is reflected in the strong performance of the relative value model.
Developed Europe
In Europe, the Earnings Momentum Model enjoyed an 83% hit rate as investors paid attention to analysts' estimates. The model returned a cumulative spread return of 11.5% for the year or 0.96% per month on average. Also reinforcing the notion that the outlook of analysts impacted markets is the 3-M Revision^ factor, which enjoyed a 75% hit rate as cusum return of 16.1% during the period.
Echoing their US peers, European short sellers performed well, as evident by the strong return spread delivered by the DSR factor in in Europe. The factor delivered a cusum return of 15.5% with an impressive 83% hit rate.
Asia Pacific region
The most accurate model, or one with the highest hit rate, was the Earnings Momentum model in AAC with a 92% hit rate - indicating that the regions earnings forecasts signals translated into stocks returns. Performance-wise, however, the best performing model over 2014 was the Deep Value Model, delivering 1.4% average returns monthly and cusum of 16.3% for the year.
Short sellers also performed well in the region, as "Utilisation" or the amount of shares in lending programmes actually out on loan performed well. The factor had a hit rate of 83% and a 1.99% average monthly spread and impressive cusum return of 23.8%.
*Markit Research Signals employs proprietary universes of stocks representing global markets.
^Full name of model is the 3M Revision in FY2 EPS Forecasts: Dispersion Relative.
Relte Stephen Schutte | Analyst, Markit
Tel: +44 207 064 6447
relte.schutte@markit.com
S&P Global provides industry-leading data, software and technology platforms and managed services to tackle some of the most difficult challenges in financial markets. We help our customers better understand complicated markets, reduce risk, operate more efficiently and comply with financial regulation.
This article was published by S&P Global Market Intelligence and not by S&P Global Ratings, which is a separately managed division of S&P Global.
{"items" : [
{"name":"share","enabled":true,"desc":"<strong>Share</strong>","mobdesc":"Share","options":[ {"name":"facebook","url":"https://www.facebook.com/sharer.php?u=http%3a%2f%2fwww.spglobal.com%2fmarketintelligence%2fen%2fmi%2fresearch-analysis%2f15122014-Equities-Measuring-a-year-in-short-sentiment.html","enabled":true},{"name":"twitter","url":"https://twitter.com/intent/tweet?url=http%3a%2f%2fwww.spglobal.com%2fmarketintelligence%2fen%2fmi%2fresearch-analysis%2f15122014-Equities-Measuring-a-year-in-short-sentiment.html&text=Measuring+a+year+in+short+sentiment","enabled":true},{"name":"linkedin","url":"https://www.linkedin.com/sharing/share-offsite/?url=http%3a%2f%2fwww.spglobal.com%2fmarketintelligence%2fen%2fmi%2fresearch-analysis%2f15122014-Equities-Measuring-a-year-in-short-sentiment.html","enabled":true},{"name":"email","url":"?subject=Measuring a year in short sentiment&body=http%3a%2f%2fwww.spglobal.com%2fmarketintelligence%2fen%2fmi%2fresearch-analysis%2f15122014-Equities-Measuring-a-year-in-short-sentiment.html","enabled":true},{"name":"whatsapp","url":"https://api.whatsapp.com/send?text=Measuring+a+year+in+short+sentiment http%3a%2f%2fwww.spglobal.com%2fmarketintelligence%2fen%2fmi%2fresearch-analysis%2f15122014-Equities-Measuring-a-year-in-short-sentiment.html","enabled":true}]}, {"name":"rtt","enabled":true,"mobdesc":"Top"}
]}