Customer Logins
Obtain the data you need to make the most informed decisions by accessing our extensive portfolio of information, analytics, and expertise. Sign in to the product or service center of your choice.
Customer Logins
EQUITIES COMMENTARY
Mar 09, 2015
US short sellers duel rising stocks
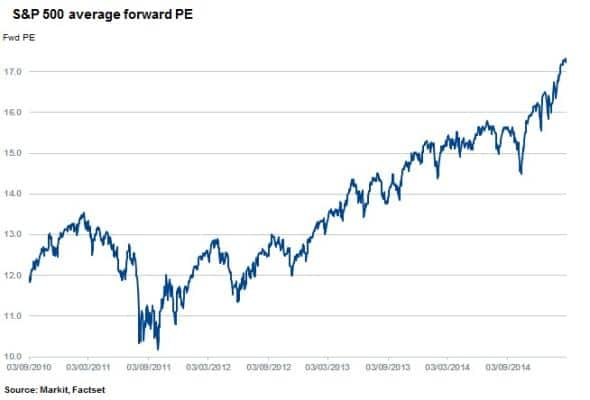
The average forward price earnings multiple of S&P 500 has broken out of three key long term averages with valuations climbing higher as investors search for yield, sending short sellers covering.
- Average shares outstanding on loan for the S&P 500 has decreased 25% since 2010
- However, which have seen relatively higher short interest, have underperformed by a third on average
- Bearish sentiment towards technology and cyclical stocks
Bulls beating back bears and short sellers
The 12 month forward price earnings (PE) ratio for the S&P 500 index broke through the 5, 10 and 15-year averages when it passed the 17.2 mark last month. This highlights the markets' recent multiyear record breaking rally, breaching 5000 points for the first time since March 2000. Similarly, the forward PE of the index has not been this high since December 2004.
Despite the majority of companies posting bumper earnings for the fourth quarter of 2014, beating analysts' forecasts, the bulk of companies which have issued guidance for 2015 thus far are guiding for lower earnings. This contrasts with current market consensus expectations for year-on-year growth in earnings in the second half of 2015.
Average short interest for the S&P 500 has decreased by 25% since 2010 while the index has returned an impressive 65% over the same time.
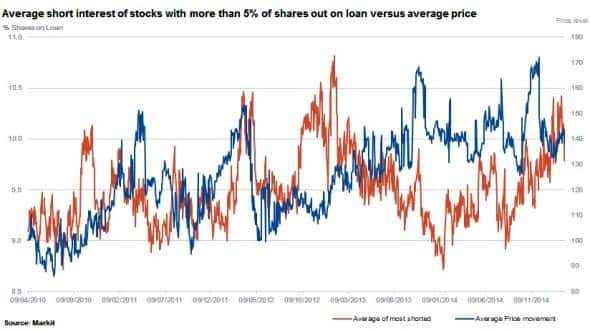
Looking deeper into the returns data reveals that average short interest across a group of heavily shorted companies (those with over 5% of shares out on loan) is almost 10%. This group has seen borrowing demand grow by 6.3% since 2010, bucking the trend towards short covering across the wider index.
However, the average price returns for this group of heavily shorted companies has increased by 43% since 2010 - representing an underperformance of the index by a third.
This universe of heavily shorted stocks has decreased in number from 87 to 54 since 2010, highlighting a concentration of material shorting activity.
Where are the bears
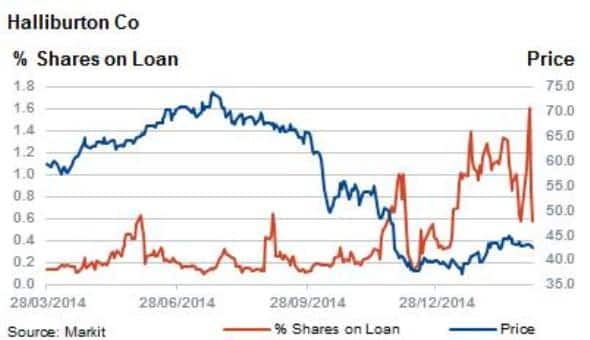
The Markit Research Signals Short Interest factor for US large cap reveals that the energy sector has seen the largest move in average short interest rankings over the past year to February 2015.
An example of this is Halliburton which has seen its ranking relative to other stocks increase from the second decile to the tenth decile since March 2014. During this time, shares out on loan have increased to 0.6% while the company's shares have decreased by 27%.
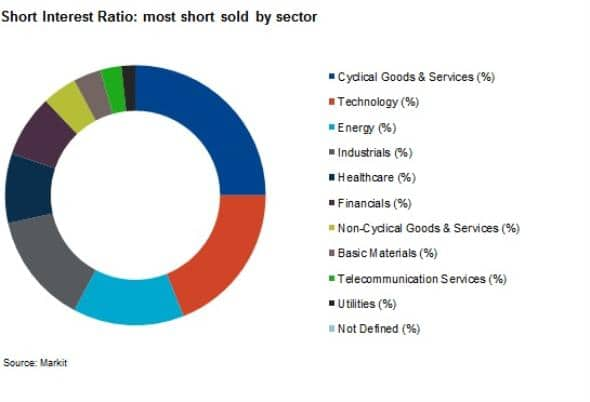
Other sectors exhibiting bearish sentiment according to the current rankings are technology, healthcare, cyclical goods & services and industrials according to this factor.
At 31 times earnings, according to historical averages, the broader technology sectors' price to earnings ratio is trading significantly above its five year historical average of 24. Relative to the market and to its own long term average, the evidence that stock price increases continue to depart from commensurate increases in earnings for the sector means that either the new higher averages will raise the long term average to a new normal or earnings growth/price declines will bring the ratio in line with historical averages.
Currently short sellers, via the factor rankings, are indicating that price declines are expected in the sector.
Relte Stephen Schutte | Analyst, Markit
Tel: +44 207 064 6447
relte.schutte@markit.com
S&P Global provides industry-leading data, software and technology platforms and managed services to tackle some of the most difficult challenges in financial markets. We help our customers better understand complicated markets, reduce risk, operate more efficiently and comply with financial regulation.
This article was published by S&P Global Market Intelligence and not by S&P Global Ratings, which is a separately managed division of S&P Global.
{"items" : [
{"name":"share","enabled":true,"desc":"<strong>Share</strong>","mobdesc":"Share","options":[ {"name":"facebook","url":"https://www.facebook.com/sharer.php?u=http%3a%2f%2fwww.spglobal.com%2fmarketintelligence%2fen%2fmi%2fresearch-analysis%2f09032015-Equities-US-short-sellers-duel-rising-stocks.html","enabled":true},{"name":"twitter","url":"https://twitter.com/intent/tweet?url=http%3a%2f%2fwww.spglobal.com%2fmarketintelligence%2fen%2fmi%2fresearch-analysis%2f09032015-Equities-US-short-sellers-duel-rising-stocks.html&text=US+short+sellers+duel+rising+stocks","enabled":true},{"name":"linkedin","url":"https://www.linkedin.com/sharing/share-offsite/?url=http%3a%2f%2fwww.spglobal.com%2fmarketintelligence%2fen%2fmi%2fresearch-analysis%2f09032015-Equities-US-short-sellers-duel-rising-stocks.html","enabled":true},{"name":"email","url":"?subject=US short sellers duel rising stocks&body=http%3a%2f%2fwww.spglobal.com%2fmarketintelligence%2fen%2fmi%2fresearch-analysis%2f09032015-Equities-US-short-sellers-duel-rising-stocks.html","enabled":true},{"name":"whatsapp","url":"https://api.whatsapp.com/send?text=US+short+sellers+duel+rising+stocks http%3a%2f%2fwww.spglobal.com%2fmarketintelligence%2fen%2fmi%2fresearch-analysis%2f09032015-Equities-US-short-sellers-duel-rising-stocks.html","enabled":true}]}, {"name":"rtt","enabled":true,"mobdesc":"Top"}
]}