Customer Logins
Obtain the data you need to make the most informed decisions by accessing our extensive portfolio of information, analytics, and expertise. Sign in to the product or service center of your choice.
Customer Logins
CREDIT COMMENTARY
Jan 05, 2016
Leveraged loans end 2015 in the red
Renewed concerns about commodity pricesand turmoil in the US high yield bond market drove leveraged loan returns to end the year on a sour note.
- The 2015 return for the Markit iBoxx USD Liquid Leveraged Loan index was -2.69%
- Q4 saw liquid leveraged loans underperform liquid US high yield bonds by 58bps
- Leveraged loans ETFs saw $421m exit, the largest monthly outflow in 2015
Read the full quarterly loans market report..
The end of 2015 proved to be challenging for the riskier end of the fixed income market with leveraged loans surrendering any returns made and closing the year firmly in red. Q4 proved to be more challenging than the previous quarter, amid growing fears around the US high yield (HY), inducing volatility and forcing investors to safer havens.
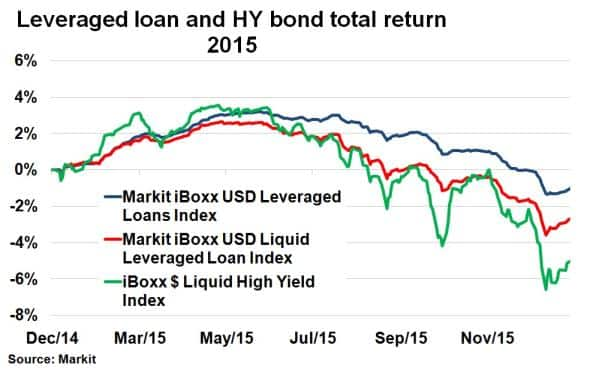
Having turned negative for the year in Q3, the total return for the Markit iBoxx USD Liquid Leveraged Loan index, a barometer for the performance of the 100 most liquid loans, continued to slide into Q4. Another 2.02% was shaved off, leaving leveraged loans investors -2.69% in the red for 2015. Even the return on the broader Markit iBoxx USD Leveraged Loan index finished the year in negative territory despite having been positive for the majority of the year. The index ended 2015 down 1.04% on a total return basis.
The falling price of commodities was again the catalyst for sparking fresh worries in Q4, especially among high yield energy names. The ensuing volatility culminated in the US high yield bond market, as represented by the Markit iBoxx $ Liquid High Yield Index, seeing its benchmark spread hit a new three and a half year high. The riskiest end of the rating spectrum, the CCC rating cohort contributed significantly to this widening and this weighed in on leveraged loan performance. This resulted in the Markit iBoxx USD Liquid Leveraged Loan index underperforming the Markit iBoxx $ Liquid High Yield Index by 58bps on a total return basis in Q4.
But while underperforming in Q4, leveraged loans proved a more worthwhile investment spanned across the whole of 2015. This is partly due to HY bonds having a much higher exposure to energy, approximately 16%, compared to 8% for leveraged loans. While commodity prices remain stubborn due to weak global fundamentals, leveraged loans may find themselves better positioned than HY bonds should commodity downside risk continue to linger.
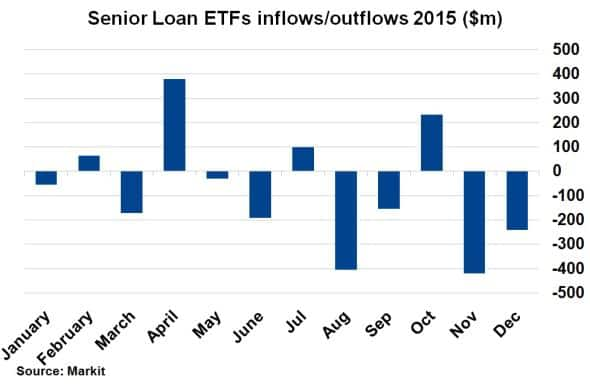
Despite October's inflows totalling $233m, ETFs tracking leveraged loans indices saw $431m of outflows in Q4 as investors ditched the asset class. November alone saw $421m of outflows, the largest monthly outflow this year and $15m more than in August as investors positioned themselves ahead of deteriorating credit conditions which followed in December. Overall, ETFs tracking leveraged loans saw $903m of outflows in 2015 according to Markit ETP data.
US HY bond ETFs fared better in comparison to leveraged loans, mimicking their outperformance on a total return basis. HY ETFs asset flows as a % of AUM were 0.27% and -2.82% for November and December, respectively, in stark comparison to leveraged loans which registered -7.09% and -4.32% respectively.
Neil Mehta, Analyst, Fixed Income, Markit
Tel: +44 207 260 2298
Neil.Mehta@markit.com
S&P Global provides industry-leading data, software and technology platforms and managed services to tackle some of the most difficult challenges in financial markets. We help our customers better understand complicated markets, reduce risk, operate more efficiently and comply with financial regulation.
This article was published by S&P Global Market Intelligence and not by S&P Global Ratings, which is a separately managed division of S&P Global.
{"items" : [
{"name":"share","enabled":true,"desc":"<strong>Share</strong>","mobdesc":"Share","options":[ {"name":"facebook","url":"https://www.facebook.com/sharer.php?u=http%3a%2f%2fwww.spglobal.com%2fmarketintelligence%2fen%2fmi%2fresearch-analysis%2f05012016-Credit-Leveraged-loans-end-2015-in-the-red.html","enabled":true},{"name":"twitter","url":"https://twitter.com/intent/tweet?url=http%3a%2f%2fwww.spglobal.com%2fmarketintelligence%2fen%2fmi%2fresearch-analysis%2f05012016-Credit-Leveraged-loans-end-2015-in-the-red.html&text=Leveraged+loans+end+2015+in+the+red","enabled":true},{"name":"linkedin","url":"https://www.linkedin.com/sharing/share-offsite/?url=http%3a%2f%2fwww.spglobal.com%2fmarketintelligence%2fen%2fmi%2fresearch-analysis%2f05012016-Credit-Leveraged-loans-end-2015-in-the-red.html","enabled":true},{"name":"email","url":"?subject=Leveraged loans end 2015 in the red&body=http%3a%2f%2fwww.spglobal.com%2fmarketintelligence%2fen%2fmi%2fresearch-analysis%2f05012016-Credit-Leveraged-loans-end-2015-in-the-red.html","enabled":true},{"name":"whatsapp","url":"https://api.whatsapp.com/send?text=Leveraged+loans+end+2015+in+the+red http%3a%2f%2fwww.spglobal.com%2fmarketintelligence%2fen%2fmi%2fresearch-analysis%2f05012016-Credit-Leveraged-loans-end-2015-in-the-red.html","enabled":true}]}, {"name":"rtt","enabled":true,"mobdesc":"Top"}
]}