
Analyze detailed inventory data for more than 19,000 US dealers
The Retail Advertised Inventory solution provides a near real time understanding on how advertised inventory affects market share gains and losses, enabling users to optimize incentive spending, production allocation and product mix on a weekly and monthly basis. It uniquely provides details at both a vehicle and geographic level in order to pinpoint opportunities and risks arising from the competitive environment.
Covering over 19,000 dealer sites in the United States the solution gives a comprehensive view of the online new vehicle virtual showrooms being promoted by franchised and unfranchised dealers alike, covering over 90% of all new vehicles sold nationwide. Access trends and the composition of retail advertised inventory with 40+ attributes such as model, trim, model year, fuel type at a national, state, DMA and dealer level of geographic detail.
Key Questions Answered
- What vehicles are being advertised by dealers today in the US, in a specific region or market?
- Where is the biggest opportunity (for my brand) based on competitive inventory levels?
- When are competitors showing new models and rolling over model year inventory on dealer websites?
- What is the composition of the inventory competitors are advertising in a specific market?
- How can (my brand) leverage incentives and advertising programs to support loyalty and drive conquest opportunities?
Advertised Inventory Coverage
Only S&P Global Mobility provides new vehicle inventory listings straight from the dealers' websites with over 90% coverage in the US.
Over 19,000 websites and 3.5 million listings are reviewed daily, that are then cleansed and normalized for use.
![]()
Vehicles available on dealer sites
![]()
Macro- to micro-level detail
![]()
Easy to consume data delivery
Local Market Advertised Inventory Trends
Industry-leading advertised inventory at all levels:
![]()
- National
- State
- DMA
- Dealer
![]()
- Vehicle Make
- Model
- Trim
- Model Year
- Fuel Type
- MSRP and List Price
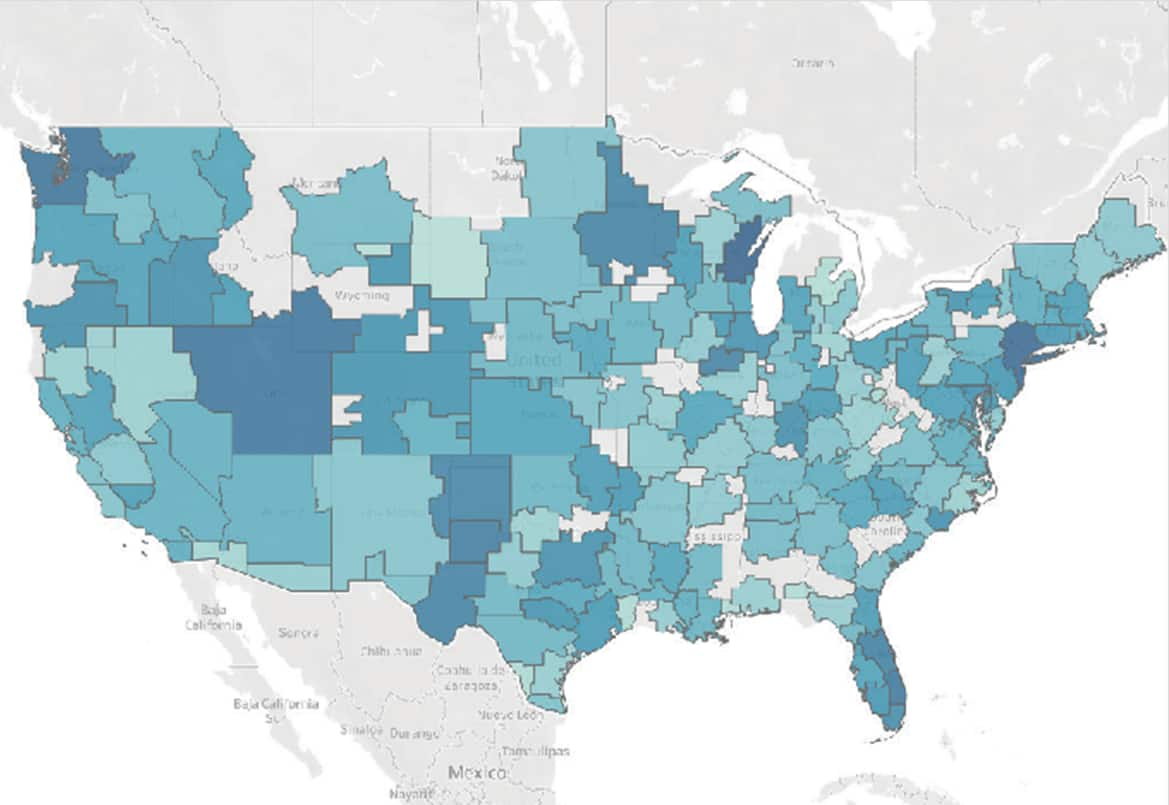
Share of Inventory Volume by DMA®
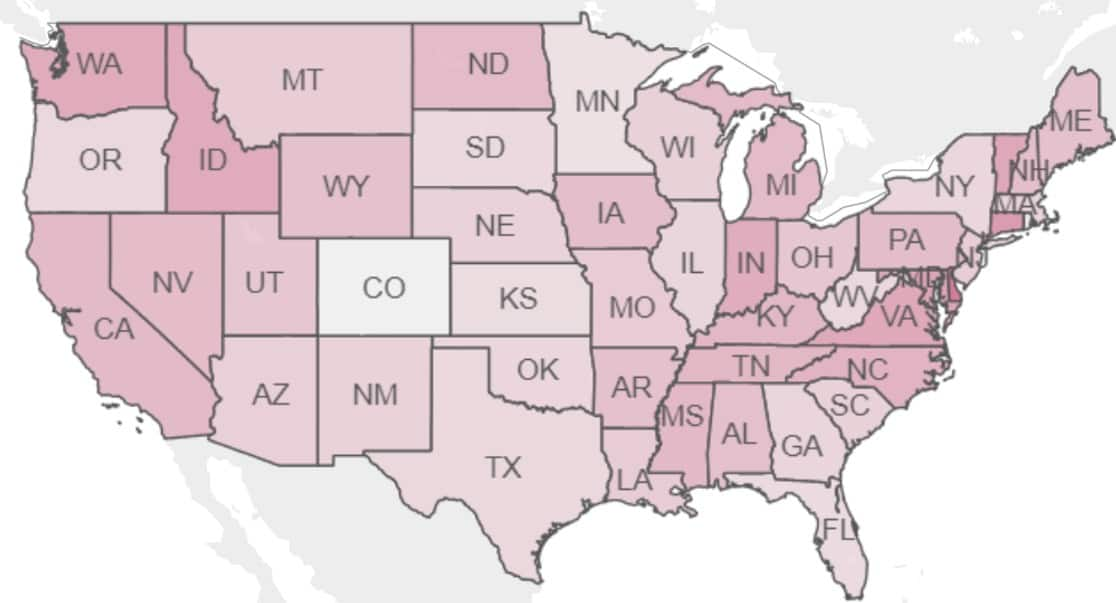
Age of Inventory By State
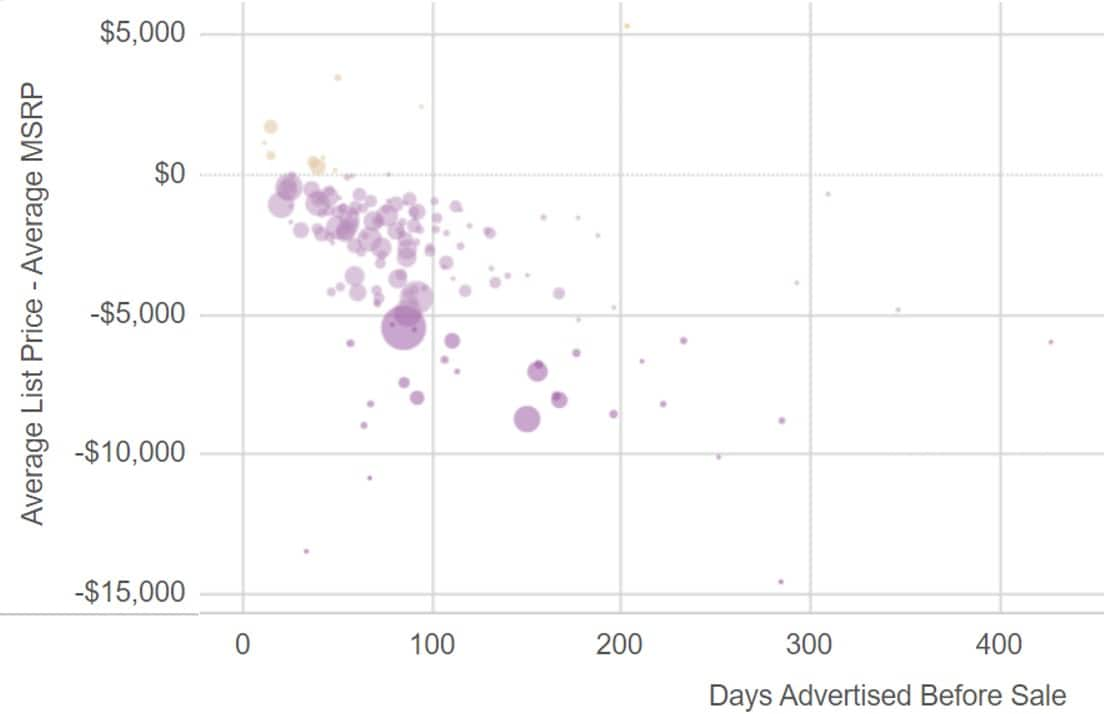
Avg. Advertised Discount vs. Days Advertised Before Sale
Find out how you can optimize incentive spending with Retail Advertised Inventory
Staying Competitive
- Real time understanding on how advertised inventory is affecting market share gains and losses
- Optimize incentive spending by leveraging regional support
- Target customers that are ready to buy in key areas through inventory-based advertising

Integrated within the Catalyst for Insight platform, enabling an aligned analysis over several datasets.